29
/es/
es
AIzaSyAYiBZKx7MnpbEhh9jyipgxe19OcubqV5w
April 1, 2024
33442
European Union
EUU
false
2
1
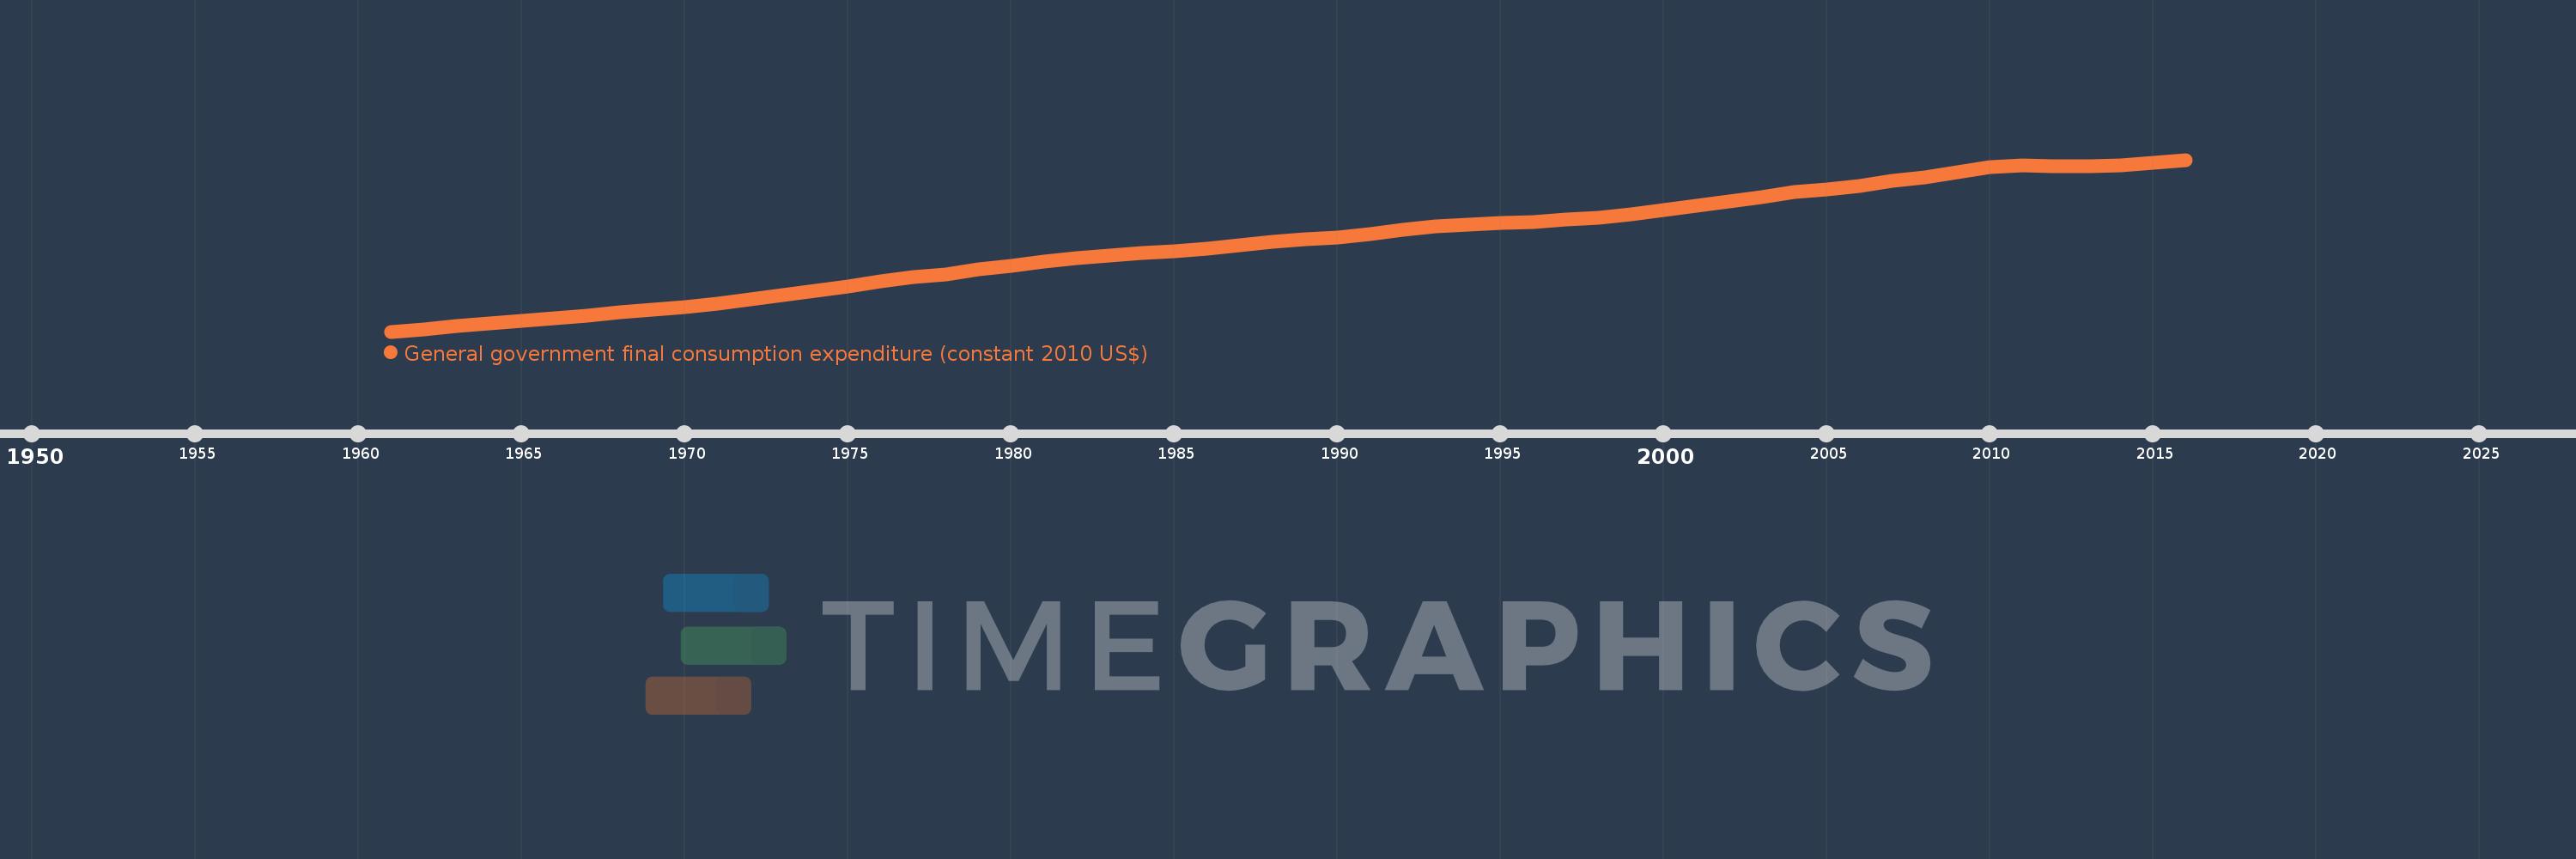
General government final consumption expenditure (constant 2010 US$)
2016,2015,2014,2013,2012,2011,2010,2009,2008,2007,2006,2005,2004,2003,2002,2001,2000,1999,1998,1997,1996,1995,1994,1993,1992,1991,1990,1989,1988,1987,1986,1985,1984,1983,1982,1981,1980,1979,1978,1977,1976,1975,1974,1973,1972,1971,1970,1969,1968,1967,1966,1965,1964,1963,1962,1961
Estas estadísticas en otros países:
AfghanistanAlbaniaAlgeriaAngolaAntigua and BarbudaArab WorldArgentinaArmeniaArubaAustraliaAustriaAzerbaijanBahamas, TheBahrainBangladeshBarbadosBelarusBelgiumBelizeBeninBermudaBhutanBoliviaBosnia and HerzegovinaBotswanaBrazilBrunei DarussalamBulgariaBurkina FasoBurundiCabo VerdeCambodiaCameroonCanadaCaribbean small statesCentral African RepublicCentral Europe and the BalticsChadChileChinaColombiaComorosCongo, Dem. Rep.Congo, Rep.Costa RicaCote d'IvoireCroatiaCubaCyprusCzech RepublicDenmarkDominicaDominican RepublicEarly-demographic dividendEast Asia & PacificEast Asia & Pacific (excluding high income)East Asia & Pacific (IDA & IBRD countries)EcuadorEgypt, Arab Rep.El SalvadorEquatorial GuineaEritreaEstoniaEuro areaEurope & Central AsiaEurope & Central Asia (excluding high income)Europe & Central Asia (IDA & IBRD countries)European UnionFaroe IslandsFinlandFragile and conflict affected situationsFranceGabonGambia, TheGeorgiaGermanyGhanaGreeceGrenadaGuatemalaGuineaGuinea-BissauGuyanaHaitiHeavily indebted poor countries (HIPC)High incomeHondurasHong Kong SAR, ChinaHungaryIBRD onlyIcelandIDA & IBRD totalIDA blendIDA onlyIDA totalIndiaIndonesiaIran, Islamic Rep.IraqIrelandIsraelItalyJamaicaJapanJordanKazakhstanKenyaKorea, Rep.KosovoKuwaitKyrgyz RepublicLao PDRLate-demographic dividendLatin America & Caribbean Latin America & Caribbean (excluding high income)Latin America & the Caribbean (IDA & IBRD countries)LatviaLeast developed countries: UN classificationLebanonLiberiaLithuaniaLow & middle incomeLow incomeLower middle incomeLuxembourgMacao SAR, ChinaMacedonia, FYRMadagascarMalawiMalaysiaMaliMaltaMauritaniaMauritiusMexicoMiddle East & North AfricaMiddle East & North Africa (excluding high income)Middle East & North Africa (IDA & IBRD countries)Middle incomeMoldovaMongoliaMontenegroMoroccoMozambiqueNamibiaNepalNetherlandsNew ZealandNicaraguaNigerNigeriaNorth AmericaNorwayOECD membersOmanOther small statesPakistanPanamaParaguayPeruPhilippinesPolandPortugalPost-demographic dividendPre-demographic dividendPuerto RicoQatarRomaniaRussian FederationRwandaSaudi ArabiaSenegalSerbiaSeychellesSierra LeoneSingaporeSlovak RepublicSloveniaSmall statesSouth AfricaSouth AsiaSouth Asia (IDA & IBRD)South SudanSpainSri LankaSt. Kitts and NevisSt. LuciaSt. Vincent and the GrenadinesSub-Saharan Africa Sub-Saharan Africa (excluding high income)Sub-Saharan Africa (IDA & IBRD countries)SudanSurinameSwazilandSwedenSwitzerlandTajikistanTanzaniaThailandTimor-LesteTogoTongaTrinidad and TobagoTunisiaTurkeyTurkmenistanUgandaUkraineUnited Arab EmiratesUnited KingdomUnited StatesUpper middle incomeUruguayUzbekistanVanuatuVenezuela, RBVietnamWest Bank and GazaWorldYemen, Rep.ZambiaZimbabwe línea de tiempo (timeline):
En esta escala de tiempo se presenta un gráfico de 1961 y 2016 de European Union. Los datos de 1960 están ausentes. El número de observaciones reales por fecha: 56.
Fuente (nombre):
Indicadores del desarrollo mundial
Fuente (organización):
World Bank national accounts data, and OECD National Accounts data files.
Categorías:
Economy & Growth
Se ha actualizado:
23 abr 2017 año
Los indicadores de los cambios de valor en los últimos años
En promedio:
2.393 billones
Mínimo:
957.768 bn
1 ene 1961 año
Máximo:
3.74 billones
1 ene 2016 año
A la fecha de observación
Valor
Cambio absoluto
El cambio con respecto al valor anterior
1 ene 1961 año
957.768 bn
+957.768 bn
0.0%
1 ene 1962 año
996.773 bn
+39.005 bn
4.07%
1 ene 1963 año
1.042 billones
+45.179 bn
4.53%
1 ene 1964 año
1.091 billones
+48.626 bn
4.67%
1 ene 1965 año
1.127 billones
+36.16 bn
3.32%
1 ene 1966 año
1.174 billones
+47.715 bn
4.23%
1 ene 1967 año
1.215 billones
+40.11 bn
3.42%
1 ene 1968 año
1.272 billones
+57.663 bn
4.75%
1 ene 1969 año
1.318 billones
+45.371 bn
3.57%
1 ene 1970 año
1.352 billones
+34.886 bn
2.65%
1 ene 1971 año
1.408 billones
+55.929 bn
4.14%
1 ene 1972 año
1.479 billones
+70.475 bn
5.0%
1 ene 1973 año
1.55 billones
+71.173 bn
4.81%
1 ene 1974 año
1.624 billones
+73.869 bn
4.77%
1 ene 1975 año
1.695 billones
+70.681 bn
4.35%
1 ene 1976 año
1.778 billones
+82.907 bn
4.89%
1 ene 1977 año
1.839 billones
+61.312 bn
3.45%
1 ene 1978 año
1.882 billones
+43.522 bn
2.37%
1 ene 1979 año
1.961 billones
+78.228 bn
4.16%
1 ene 1980 año
2.026 billones
+64.931 bn
3.31%
1 ene 1981 año
2.089 billones
+63.507 bn
3.14%
1 ene 1982 año
2.151 billones
+62.18 bn
2.98%
1 ene 1983 año
2.187 billones
+35.561 bn
1.65%
1 ene 1984 año
2.226 billones
+39.53 bn
1.81%
1 ene 1985 año
2.255 billones
+29.092 bn
1.31%
1 ene 1986 año
2.302 billones
+46.924 bn
2.08%
1 ene 1987 año
2.35 billones
+47.28 bn
2.05%
1 ene 1988 año
2.405 billones
+55.553 bn
2.36%
1 ene 1989 año
2.451 billones
+45.639 bn
1.9%
1 ene 1990 año
2.474 billones
+23.643 bn
0.96%
1 ene 1991 año
2.538 billones
+63.527 bn
2.57%
1 ene 1992 año
2.608 billones
+69.833 bn
2.75%
1 ene 1993 año
2.665 billones
+57.475 bn
2.2%
1 ene 1994 año
2.691 billones
+25.772 bn
0.97%
1 ene 1995 año
2.713 billones
+22.288 bn
0.83%
1 ene 1996 año
2.738 billones
+24.643 bn
0.91%
1 ene 1997 año
2.777 billones
+39.489 bn
1.44%
1 ene 1998 año
2.805 billones
+27.214 bn
0.98%
1 ene 1999 año
2.858 billones
+53.179 bn
1.9%
1 ene 2000 año
2.924 billones
+66.014 bn
2.31%
1 ene 2001 año
2.995 billones
+71.451 bn
2.44%
1 ene 2002 año
3.067 billones
+71.472 bn
2.39%
1 ene 2003 año
3.141 billones
+74.674 bn
2.43%
1 ene 2004 año
3.213 billones
+71.922 bn
2.29%
1 ene 2005 año
3.264 billones
+50.816 bn
1.58%
1 ene 2006 año
3.321 billones
+56.843 bn
1.74%
1 ene 2007 año
3.393 billones
+72.024 bn
2.17%
1 ene 2008 año
3.456 billones
+62.523 bn
1.84%
1 ene 2009 año
3.539 billones
+83.415 bn
2.41%
1 ene 2010 año
3.619 billones
+79.529 bn
2.25%
1 ene 2011 año
3.645 billones
+26.169 bn
0.72%
1 ene 2012 año
3.641 billones
-3.663 bn
-0.1%
1 ene 2013 año
3.64 billones
-780.317 millones
-0.02%
1 ene 2014 año
3.651 billones
+10.596 bn
0.29%
1 ene 2015 año
3.687 billones
+36.586 bn
1.0%
1 ene 2016 año
3.74 billones
+52.759 bn
1.43%
Ranking de los países por los datos estadísticos actuales


Comentarios: