30
/es/
AIzaSyAYiBZKx7MnpbEhh9jyipgxe19OcubqV5w
April 1, 2024
30603
Europe & Central Asia
ECS
false
2
1
Employment in industry, female (% of female employment)
2015,2014,2013,2012,2011,2010,2009,2008,2007,2006,2005,2004,2003,2002,2001,2000,1999,1998
Download
Estadísticas Globales de la Biblioteca →Europe & Central Asia →

Employment in industry, female (% of female employment)

Estas estadísticas en otros países:

AlbaniaAlgeriaAmerican SamoaAntigua and BarbudaArab WorldArgentinaArmeniaArubaAustraliaAustriaAzerbaijanBahamas, TheBahrainBangladeshBarbadosBelarusBelgiumBelizeBeninBermudaBhutanBoliviaBotswanaBrazilBritish Virgin IslandsBrunei DarussalamBulgariaBurkina FasoBurundiCambodiaCameroonCanadaCaribbean small statesCayman IslandsCentral Europe and the BalticsChadChileChinaColombiaCongo, Rep.Costa RicaCroatiaCubaCyprusCzech RepublicDenmarkDominicaDominican RepublicEarly-demographic dividendEast Asia & PacificEast Asia & Pacific (excluding high income)East Asia & Pacific (IDA & IBRD countries)EcuadorEgypt, Arab Rep.El SalvadorEquatorial GuineaEstoniaEthiopiaEuro areaEurope & Central AsiaEurope & Central Asia (excluding high income)Europe & Central Asia (IDA & IBRD countries)European UnionFaroe IslandsFijiFinlandFranceGabonGambia, TheGeorgiaGermanyGhanaGreeceGreenlandGrenadaGuatemalaGuineaGuyanaHaitiHigh incomeHondurasHong Kong SAR, ChinaHungaryIBRD onlyIcelandIDA & IBRD totalIDA blendIndiaIndonesiaIran, Islamic Rep.IraqIrelandIsle of ManIsraelItalyJamaicaJapanJordanKazakhstanKenyaKiribatiKorea, Rep.KosovoKuwaitKyrgyz RepublicLao PDRLate-demographic dividendLatin America & Caribbean Latin America & Caribbean (excluding high income)Latin America & the Caribbean (IDA & IBRD countries)LatviaLesothoLiberiaLithuaniaLow & middle incomeLower middle incomeLuxembourgMacao SAR, ChinaMacedonia, FYRMadagascarMalawiMalaysiaMaldivesMaliMaltaMarshall IslandsMauritiusMexicoMiddle East & North AfricaMiddle East & North Africa (excluding high income)Middle East & North Africa (IDA & IBRD countries)Middle incomeMoldovaMongoliaMontenegroMoroccoMozambiqueNamibiaNepalNetherlandsNew CaledoniaNew ZealandNicaraguaNigerNigeriaNorth AmericaNorthern Mariana IslandsNorwayOECD membersOmanPakistanPalauPanamaParaguayPeruPhilippinesPolandPortugalPost-demographic dividendPuerto RicoQatarRomaniaRussian FederationRwandaSamoaSan MarinoSao Tome and PrincipeSaudi ArabiaSenegalSerbiaSeychellesSierra LeoneSingaporeSlovak RepublicSloveniaSouth AfricaSouth AsiaSouth Asia (IDA & IBRD)SpainSri LankaSt. Kitts and NevisSt. LuciaSt. Vincent and the GrenadinesSudanSurinameSwedenSwitzerlandSyrian Arab RepublicTajikistanTanzaniaThailandTimor-LesteTogoTongaTrinidad and TobagoTunisiaTurkeyUgandaUkraineUnited Arab EmiratesUnited KingdomUnited StatesUpper middle incomeUruguayVanuatuVenezuela, RBVietnamWest Bank and GazaWorldYemen, Rep.ZambiaZimbabwe

línea de tiempo (timeline):

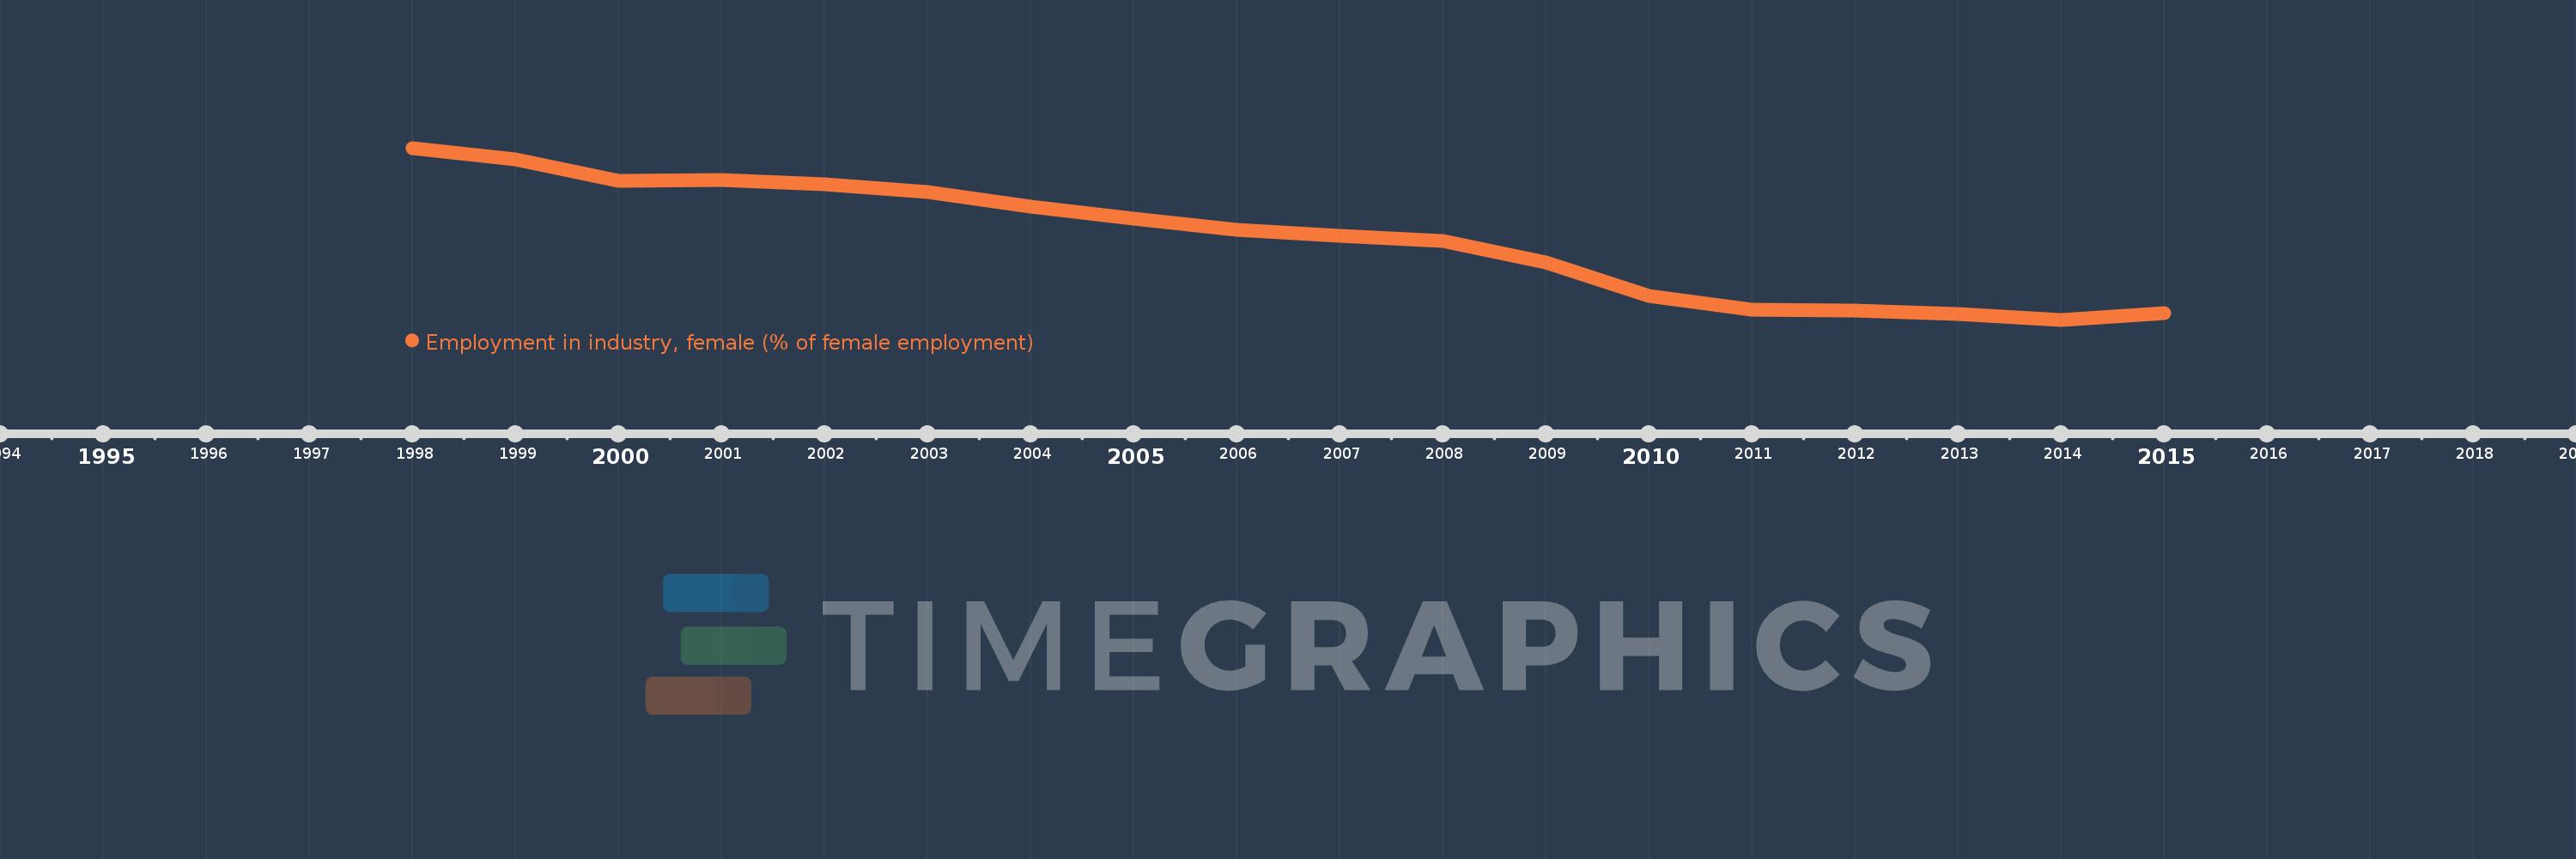
En esta escala de tiempo se presenta un gráfico de 1998 y 2015 de Europe & Central Asia. Los datos de 1997 están ausentes. El número de observaciones reales por fecha: 18.

Fuente (nombre):

Indicadores del desarrollo mundial

Fuente (organización):

International Labour Organization, Key Indicators of the Labour Market database.

Categorías:

Social Protection & Labor, Gender

Se ha actualizado:

23 abr 2017 año

Los indicadores de los cambios de valor en los últimos años

En promedio:
15.821
Mínimo:
13.46
1 ene 2014 año
Máximo:
18.481
1 ene 1998 año
A la fecha de observación
Valor
Cambio absoluto
El cambio con respecto al valor anterior
1 ene 1998 año
18.481
+18.481
0.0%
1 ene 1999 año
18.144
-0.338
-1.83%
1 ene 2000 año
17.519
-0.624
-3.44%
1 ene 2001 año
17.534
+0.014
0.08%
1 ene 2002 año
17.42
-0.114
-0.65%
1 ene 2003 año
17.201
-0.22
-1.26%
1 ene 2004 año
16.766
-0.434
-2.52%
1 ene 2005 año
16.417
-0.35
-2.09%
1 ene 2006 año
16.083
-0.334
-2.03%
1 ene 2007 año
15.924
-0.159
-0.99%
1 ene 2008 año
15.77
-0.154
-0.97%
1 ene 2009 año
15.133
-0.637
-4.04%
1 ene 2010 año
14.167
-0.966
-6.39%
1 ene 2011 año
13.748
-0.419
-2.96%
1 ene 2012 año
13.739
-0.009
-0.06%
1 ene 2013 año
13.624
-0.116
-0.84%
1 ene 2014 año
13.46
-0.164
-1.2%
1 ene 2015 año
13.652
+0.192
1.43%

Ranking de los países por los datos estadísticos actuales