29
/es/
es
AIzaSyAYiBZKx7MnpbEhh9jyipgxe19OcubqV5w
April 1, 2024
30391
Euro area
EMU
false
2
1
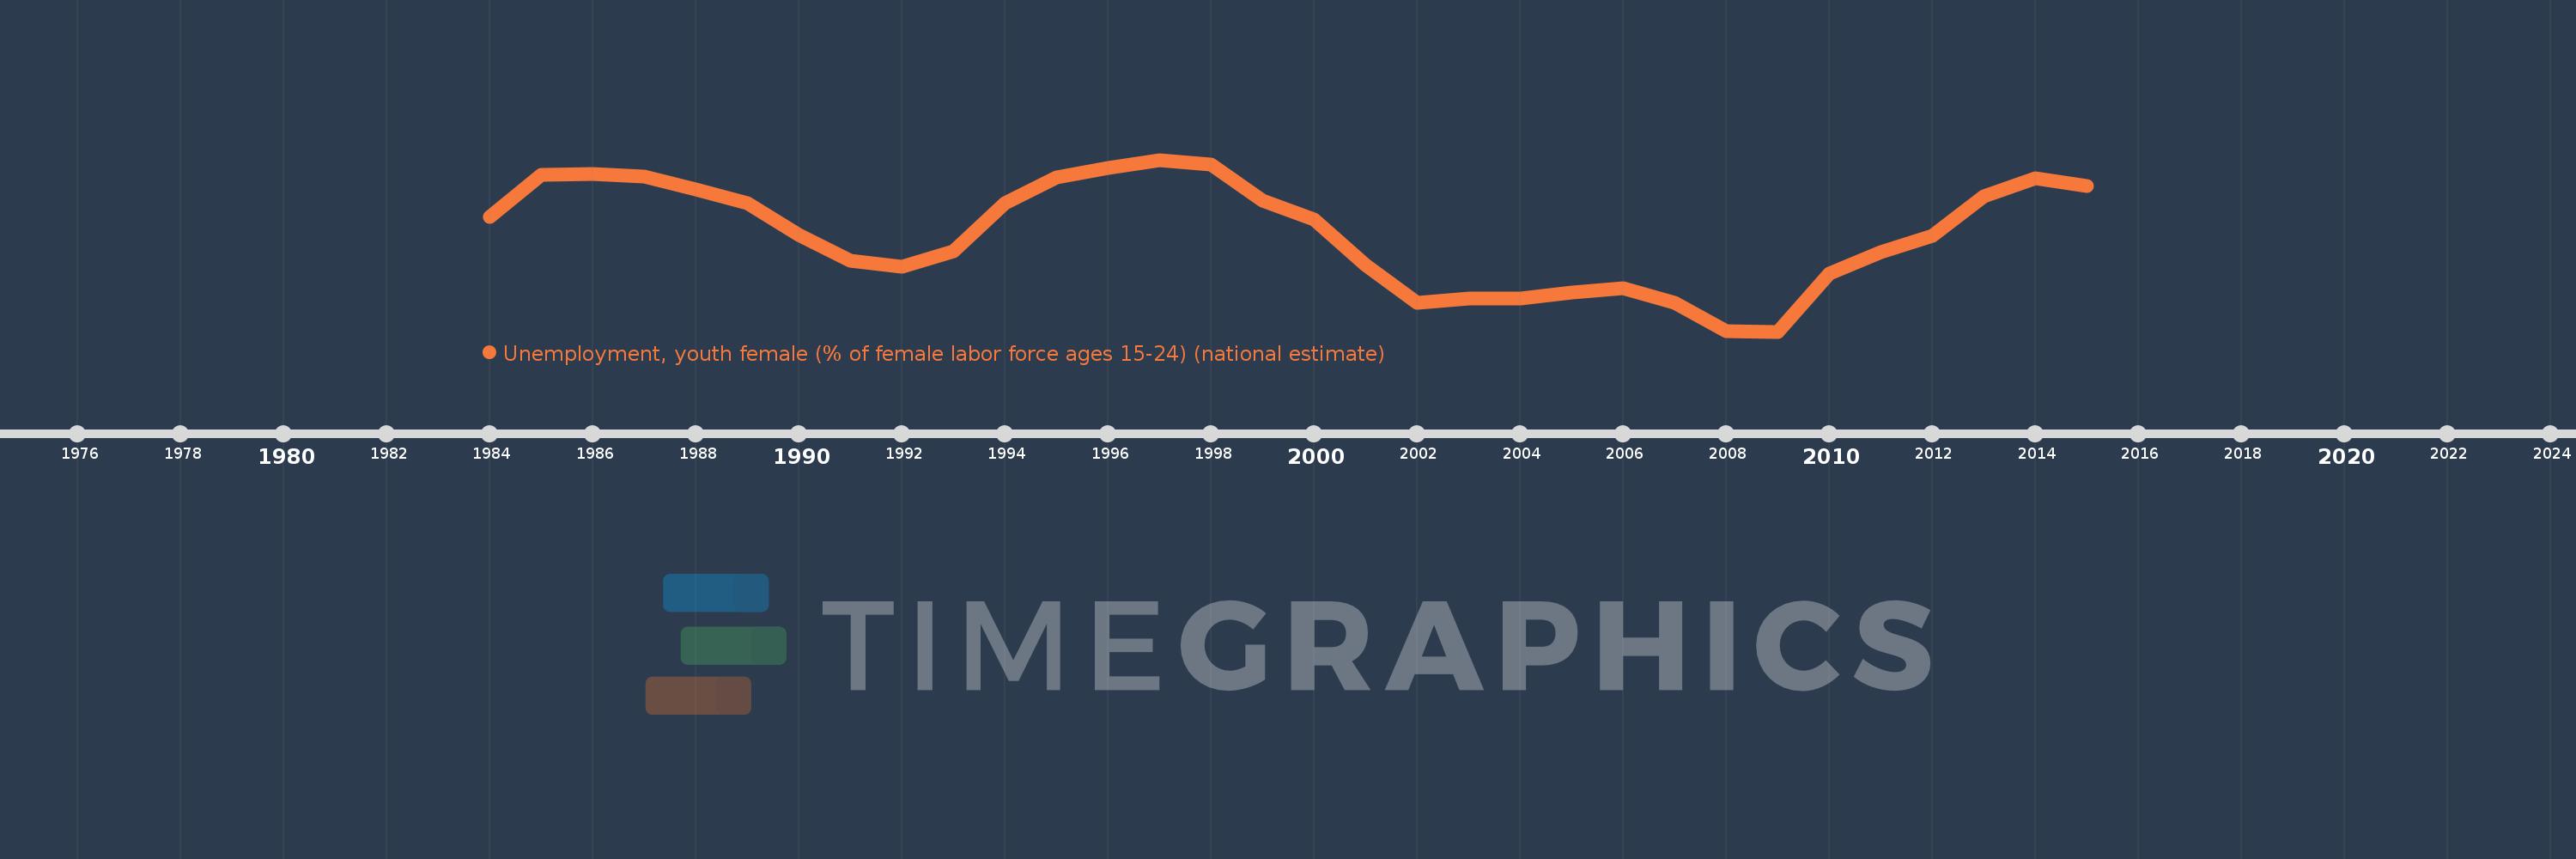
Unemployment, youth female (% of female labor force ages 15-24) (national estimate)
2015,2014,2013,2012,2011,2010,2009,2008,2007,2006,2005,2004,2003,2002,2001,2000,1999,1998,1997,1996,1995,1994,1993,1992,1991,1990,1989,1988,1987,1986,1985,1984
Estas estadísticas en otros países:
AlbaniaAlgeriaAmerican SamoaAntigua and BarbudaArab WorldArgentinaArmeniaArubaAustraliaAustriaAzerbaijanBahamas, TheBahrainBangladeshBarbadosBelarusBelgiumBelizeBeninBermudaBhutanBoliviaBosnia and HerzegovinaBotswanaBrazilBritish Virgin IslandsBulgariaBurkina FasoBurundiCabo VerdeCambodiaCameroonCanadaCaribbean small statesCayman IslandsCentral Europe and the BalticsChileColombiaCosta RicaCroatiaCubaCyprusCzech RepublicDenmarkDominicaDominican RepublicEarly-demographic dividendEcuadorEgypt, Arab Rep.El SalvadorEstoniaEthiopiaEuro areaEurope & Central AsiaEurope & Central Asia (excluding high income)Europe & Central Asia (IDA & IBRD countries)European UnionFaroe IslandsFijiFinlandFranceFrench PolynesiaGabonGambia, TheGeorgiaGermanyGhanaGreeceGrenadaGuamGuatemalaGuineaGuyanaHaitiHigh incomeHondurasHong Kong SAR, ChinaHungaryIcelandIndiaIndonesiaIran, Islamic Rep.IrelandIsle of ManIsraelItalyJamaicaJapanJordanKazakhstanKiribatiKorea, Rep.KosovoKuwaitKyrgyz RepublicLao PDRLatin America & Caribbean Latin America & Caribbean (excluding high income)Latin America & the Caribbean (IDA & IBRD countries)LatviaLebanonLesothoLiberiaLibyaLithuaniaLower middle incomeLuxembourgMacao SAR, ChinaMacedonia, FYRMadagascarMalawiMalaysiaMaldivesMaliMaltaMarshall IslandsMauritiusMexicoMiddle East & North AfricaMiddle East & North Africa (excluding high income)Middle East & North Africa (IDA & IBRD countries)MoldovaMonacoMongoliaMontenegroMoroccoMozambiqueNamibiaNauruNepalNetherlandsNew ZealandNicaraguaNigerNigeriaNorth AmericaNorthern Mariana IslandsNorwayOECD membersPakistanPalauPanamaParaguayPeruPhilippinesPolandPortugalPost-demographic dividendPuerto RicoQatarRomaniaRussian FederationRwandaSamoaSan MarinoSao Tome and PrincipeSaudi ArabiaSenegalSerbiaSeychellesSierra LeoneSingaporeSlovak RepublicSloveniaSolomon IslandsSouth AfricaSouth AsiaSouth Asia (IDA & IBRD)South SudanSpainSri LankaSt. Kitts and NevisSt. LuciaSt. Vincent and the GrenadinesSudanSurinameSwazilandSwedenSwitzerlandSyrian Arab RepublicTajikistanTanzaniaThailandTimor-LesteTongaTrinidad and TobagoTunisiaTurkeyUgandaUkraineUnited Arab EmiratesUnited KingdomUnited StatesUruguayVanuatuVenezuela, RBVietnamWest Bank and GazaYemen, Rep.ZambiaZimbabwe línea de tiempo (timeline):
En esta escala de tiempo se presenta un gráfico de 1984 y 2015 de Euro area. Los datos de 1983 están ausentes. El número de observaciones reales por fecha: 32.
Fuente (nombre):
Indicadores del desarrollo mundial
Fuente (organización):
International Labour Organization, Key Indicators of the Labour Market database.
Categorías:
Social Protection & Labor
Se ha actualizado:
23 abr 2017 año
Los indicadores de los cambios de valor en los últimos años
Mínimo:
17.36
1 ene 2009 año
Máximo:
28.094
1 ene 1997 año
A la fecha de observación
Valor
Cambio absoluto
El cambio con respecto al valor anterior
1 ene 1984 año
24.536
+24.536
0.0%
1 ene 1985 año
27.166
+2.63
10.72%
1 ene 1986 año
27.215
+0.049
0.18%
1 ene 1987 año
27.023
-0.193
-0.71%
1 ene 1988 año
26.252
-0.77
-2.85%
1 ene 1989 año
25.394
-0.858
-3.27%
1 ene 1990 año
23.393
-2.001
-7.88%
1 ene 1991 año
21.762
-1.631
-6.97%
1 ene 1992 año
21.395
-0.366
-1.68%
1 ene 1993 año
22.389
+0.993
4.64%
1 ene 1994 año
25.405
+3.016
13.47%
1 ene 1995 año
26.999
+1.593
6.27%
1 ene 1996 año
27.596
+0.597
2.21%
1 ene 1997 año
28.094
+0.498
1.81%
1 ene 1998 año
27.79
-0.304
-1.08%
1 ene 1999 año
25.525
-2.265
-8.15%
1 ene 2000 año
24.375
-1.15
-4.51%
1 ene 2001 año
21.539
-2.837
-11.64%
1 ene 2002 año
19.158
-2.38
-11.05%
1 ene 2003 año
19.428
+0.269
1.41%
1 ene 2004 año
19.437
+0.009
0.05%
1 ene 2005 año
19.79
+0.353
1.82%
1 ene 2006 año
20.097
+0.306
1.55%
1 ene 2007 año
19.158
-0.939
-4.67%
1 ene 2008 año
17.387
-1.77
-9.24%
1 ene 2009 año
17.36
-0.027
-0.16%
1 ene 2010 año
20.986
+3.626
20.89%
1 ene 2011 año
22.343
+1.357
6.47%
1 ene 2012 año
23.318
+0.974
4.36%
1 ene 2013 año
25.795
+2.477
10.62%
1 ene 2014 año
26.966
+1.171
4.54%
1 ene 2015 año
26.474
-0.492
-1.82%
Ranking de los países por los datos estadísticos actuales


Comentarios: