29
/es/
es
AIzaSyAYiBZKx7MnpbEhh9jyipgxe19OcubqV5w
April 1, 2024
30009
Euro area
EMU
false
2
1
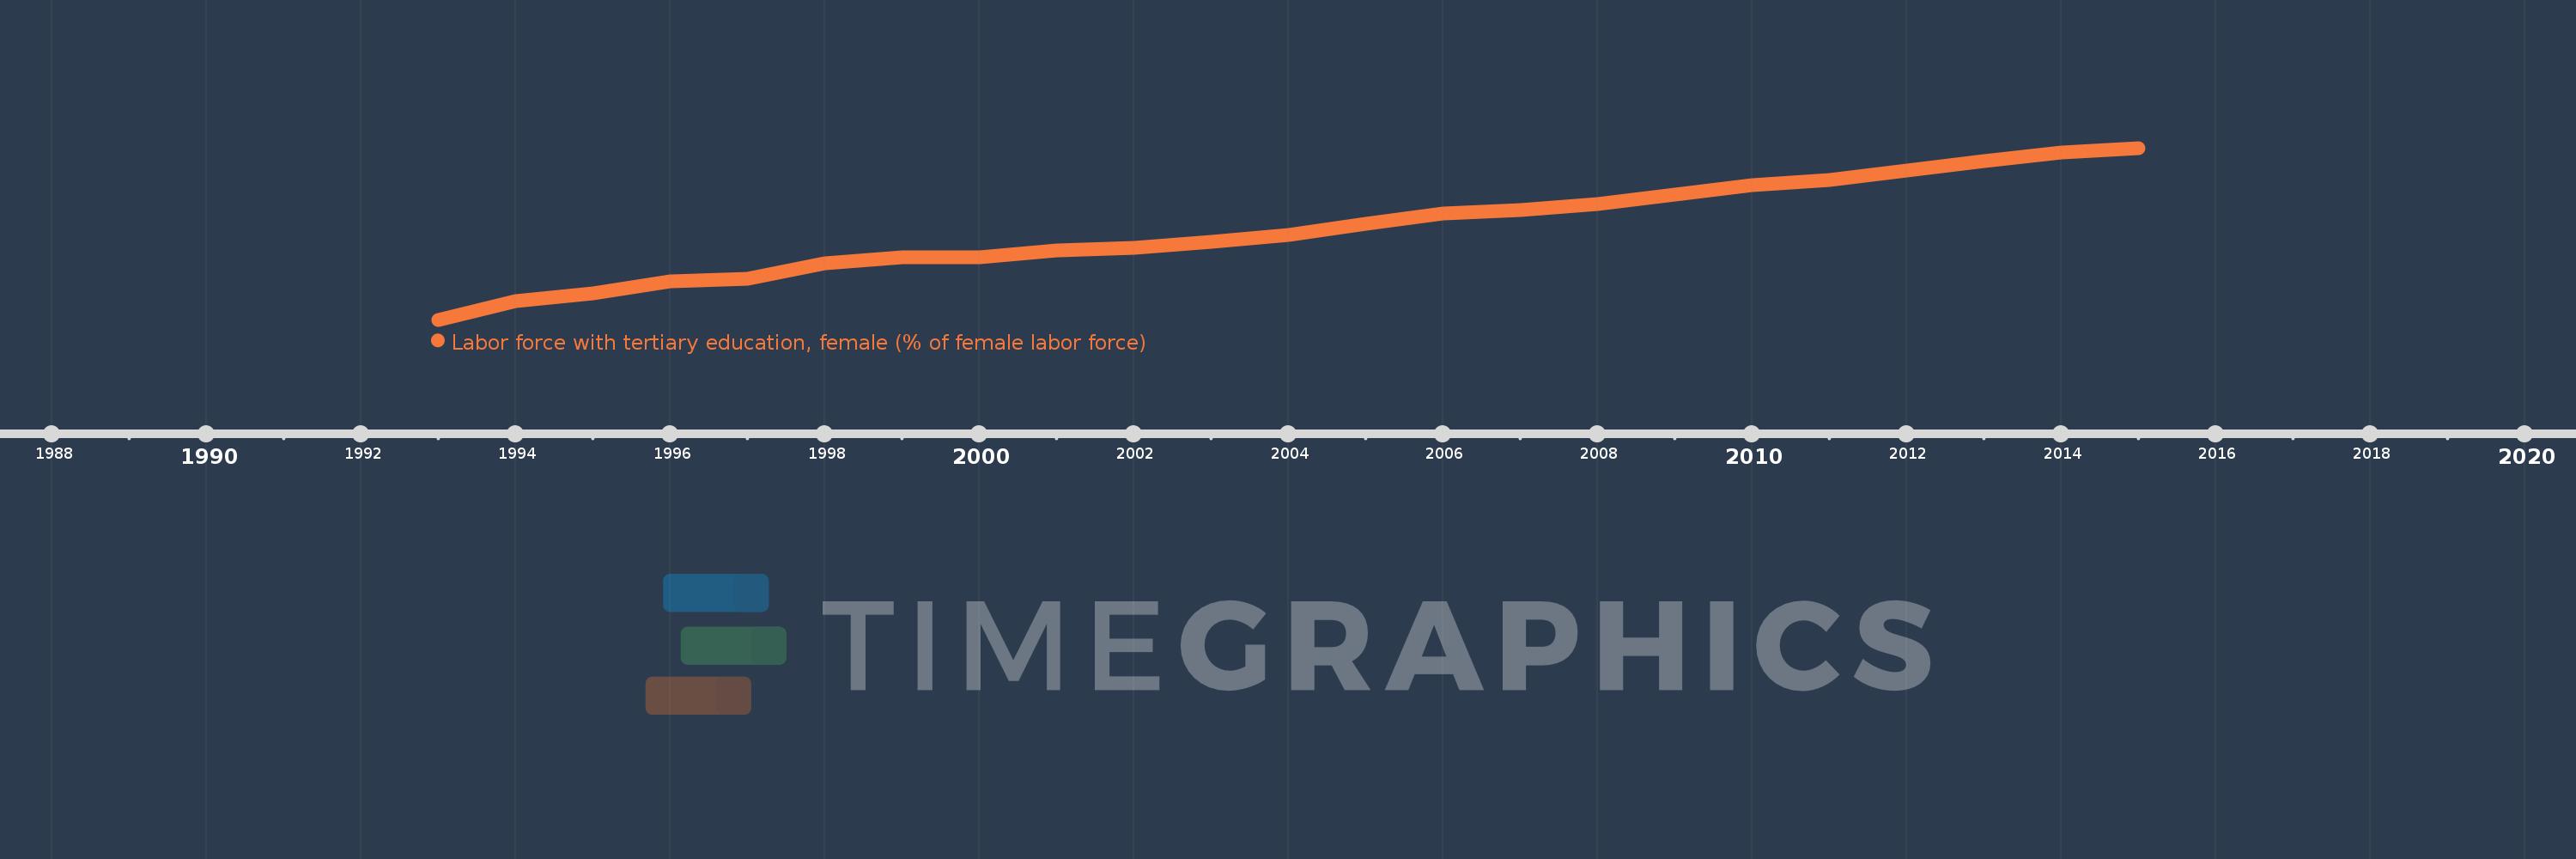
Labor force with tertiary education, female (% of female labor force)
2015,2014,2013,2012,2011,2010,2009,2008,2007,2006,2005,2004,2003,2002,2001,2000,1999,1998,1997,1996,1995,1994,1993
Estas estadísticas en otros países:
línea de tiempo (timeline):
En esta escala de tiempo se presenta un gráfico de 1993 y 2015 de Euro area. Los datos de 1992 están ausentes. El número de observaciones reales por fecha: 23.
Fuente (nombre):
Indicadores del desarrollo mundial
Fuente (organización):
International Labour Organization, Key Indicators of the Labour Market database.
Categorías:
Education, Social Protection & Labor, Gender
Se ha actualizado:
23 abr 2017 año
Los indicadores de los cambios de valor en los últimos años
Mínimo:
15.306
1 ene 1993 año
Máximo:
33.216
1 ene 2015 año
A la fecha de observación
Valor
Cambio absoluto
El cambio con respecto al valor anterior
1 ene 1993 año
15.306
+15.306
0.0%
1 ene 1994 año
17.22
+1.914
12.5%
1 ene 1995 año
18.043
+0.823
4.78%
1 ene 1996 año
19.339
+1.296
7.18%
1 ene 1997 año
19.554
+0.215
1.11%
1 ene 1998 año
21.162
+1.607
8.22%
1 ene 1999 año
21.856
+0.695
3.28%
1 ene 2000 año
21.791
-0.065
-0.3%
1 ene 2001 año
22.53
+0.739
3.39%
1 ene 2002 año
22.761
+0.231
1.03%
1 ene 2003 año
23.389
+0.628
2.76%
1 ene 2004 año
24.139
+0.75
3.21%
1 ene 2005 año
25.349
+1.211
5.02%
1 ene 2006 año
26.364
+1.015
4.0%
1 ene 2007 año
26.773
+0.409
1.55%
1 ene 2008 año
27.372
+0.599
2.24%
1 ene 2009 año
28.367
+0.995
3.64%
1 ene 2010 año
29.317
+0.95
3.35%
1 ene 2011 año
29.919
+0.603
2.06%
1 ene 2012 año
30.86
+0.941
3.14%
1 ene 2013 año
31.839
+0.979
3.17%
1 ene 2014 año
32.713
+0.874
2.75%
1 ene 2015 año
33.216
+0.502
1.54%
Ranking de los países por los datos estadísticos actuales


Comentarios: