29
/es/
es
AIzaSyAYiBZKx7MnpbEhh9jyipgxe19OcubqV5w
April 1, 2024
29890
Euro area
EMU
false
2
1
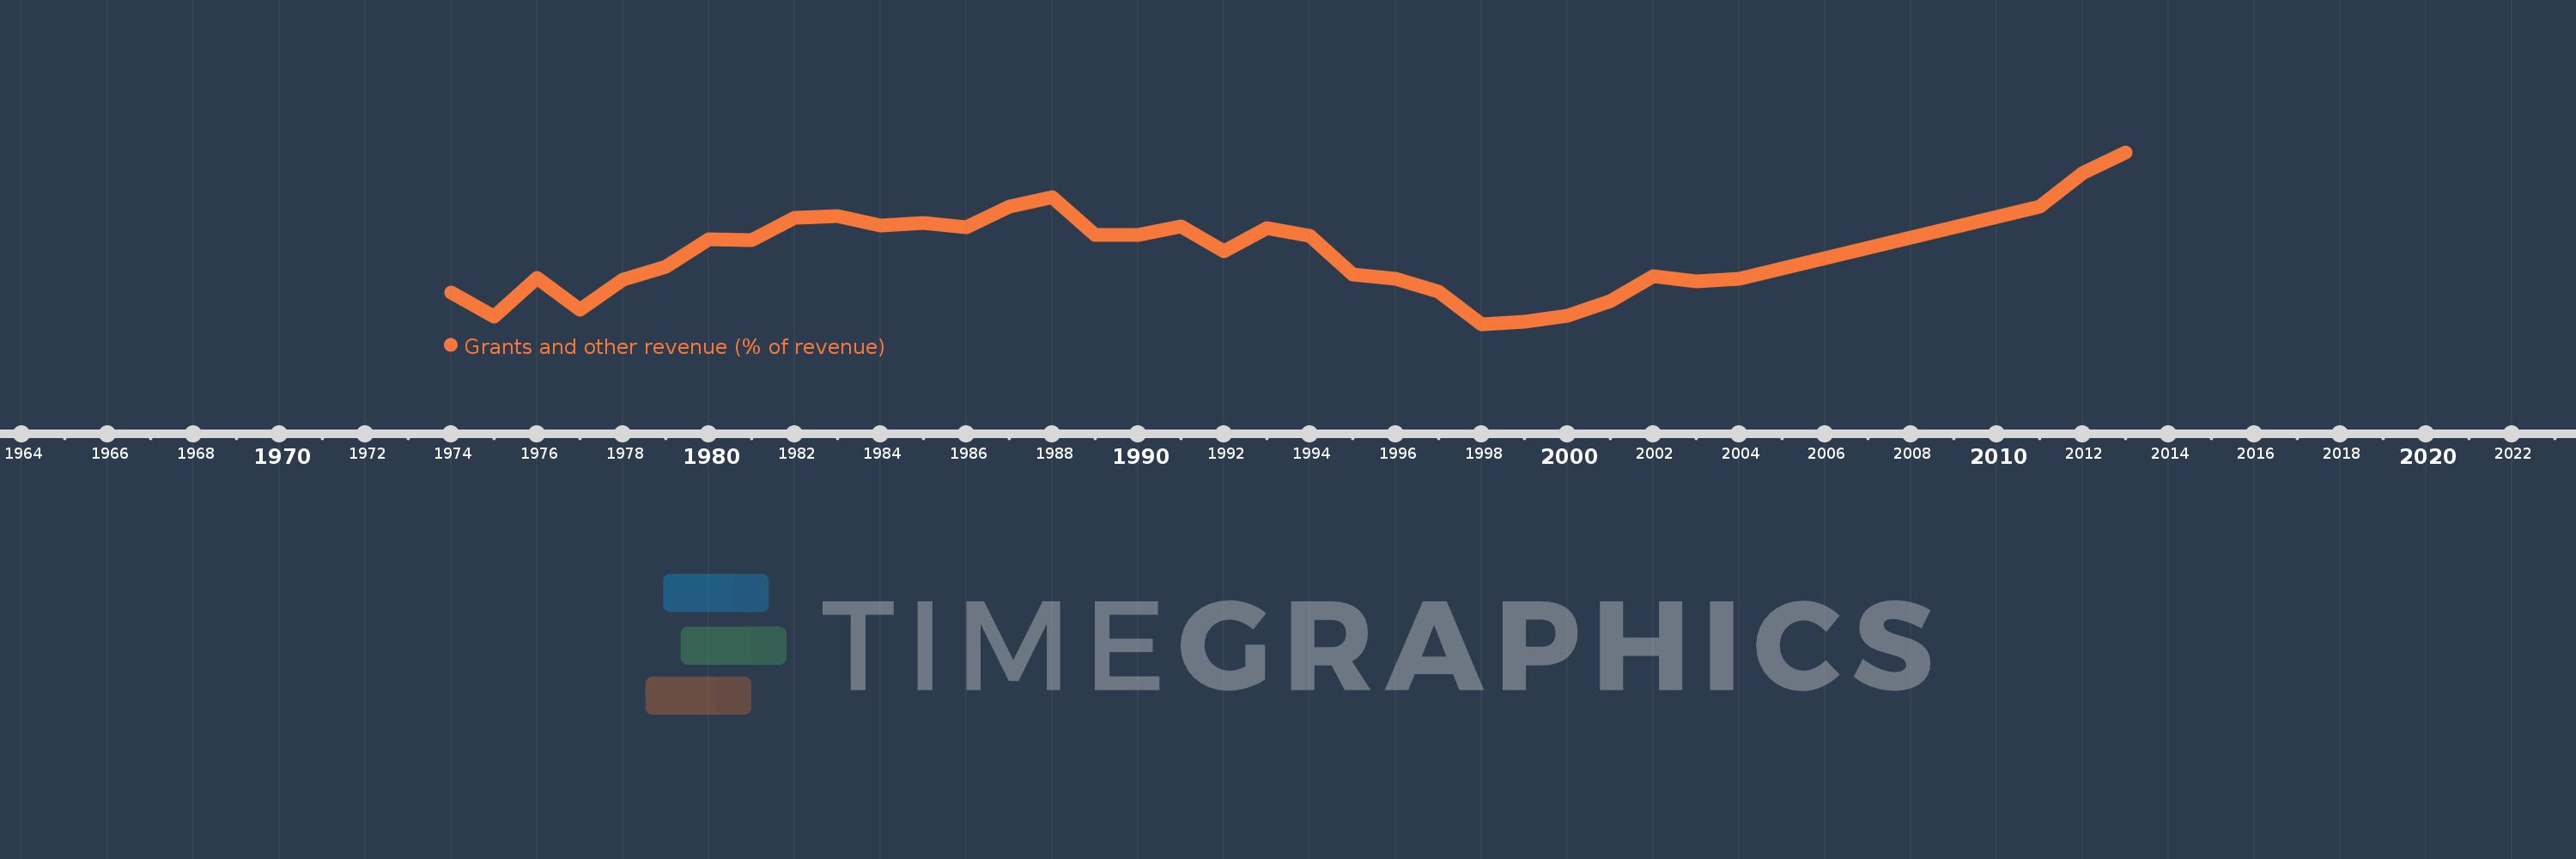
Grants and other revenue (% of revenue)
2013,2012,2011,2004,2003,2002,2001,2000,1999,1998,1997,1996,1995,1994,1993,1992,1991,1990,1989,1988,1987,1986,1985,1984,1983,1982,1981,1980,1979,1978,1977,1976,1975,1974
Estas estadísticas en otros países:
AfghanistanAlbaniaAlgeriaAngolaAntigua and BarbudaArab WorldArgentinaArmeniaAustraliaAustriaAzerbaijanBahamas, TheBahrainBangladeshBarbadosBelarusBelgiumBelizeBeninBhutanBoliviaBosnia and HerzegovinaBotswanaBrazilBulgariaBurkina FasoBurundiCabo VerdeCambodiaCanadaCaribbean small statesCentral African RepublicCentral Europe and the BalticsChileChinaColombiaCongo, Dem. Rep.Congo, Rep.Costa RicaCote d'IvoireCroatiaCyprusCzech RepublicDenmarkDominicaDominican RepublicEarly-demographic dividendEast Asia & PacificEast Asia & Pacific (excluding high income)East Asia & Pacific (IDA & IBRD countries)Egypt, Arab Rep.El SalvadorEquatorial GuineaEstoniaEthiopiaEuro areaEurope & Central AsiaEurope & Central Asia (excluding high income)Europe & Central Asia (IDA & IBRD countries)European UnionFijiFinlandFranceGambia, TheGeorgiaGermanyGhanaGreeceGrenadaGuatemalaHeavily indebted poor countries (HIPC)High incomeHondurasHong Kong SAR, ChinaHungaryIBRD onlyIcelandIDA & IBRD totalIDA blendIDA onlyIDA totalIndiaIndonesiaIran, Islamic Rep.IraqIrelandIsraelItalyJamaicaJapanJordanKazakhstanKenyaKiribatiKorea, Rep.KuwaitKyrgyz RepublicLao PDRLate-demographic dividendLatin America & Caribbean Latin America & Caribbean (excluding high income)Latin America & the Caribbean (IDA & IBRD countries)LatviaLeast developed countries: UN classificationLebanonLesothoLiberiaLithuaniaLow & middle incomeLow incomeLower middle incomeLuxembourgMacao SAR, ChinaMacedonia, FYRMadagascarMalawiMalaysiaMaldivesMaliMaltaMauritiusMexicoMicronesia, Fed. Sts.Middle East & North AfricaMiddle East & North Africa (excluding high income)Middle East & North Africa (IDA & IBRD countries)Middle incomeMoldovaMongoliaMoroccoMozambiqueMyanmarNamibiaNepalNetherlandsNew ZealandNicaraguaNigeriaNorth AmericaNorwayOECD membersOmanOther small statesPakistanPanamaPapua New GuineaParaguayPeruPhilippinesPolandPortugalPost-demographic dividendPre-demographic dividendQatarRomaniaRussian FederationRwandaSamoaSan MarinoSao Tome and PrincipeSenegalSerbiaSeychellesSierra LeoneSingaporeSlovak RepublicSloveniaSmall statesSolomon IslandsSouth AfricaSouth AsiaSouth Asia (IDA & IBRD)SpainSri LankaSt. Kitts and NevisSt. LuciaSt. Vincent and the GrenadinesSub-Saharan Africa Sub-Saharan Africa (excluding high income)Sub-Saharan Africa (IDA & IBRD countries)SurinameSwazilandSwedenSwitzerlandSyrian Arab RepublicTajikistanTanzaniaThailandTimor-LesteTogoTrinidad and TobagoTunisiaTurkeyUgandaUkraineUnited Arab EmiratesUnited KingdomUnited StatesUpper middle incomeUruguayVanuatuVenezuela, RBVietnamWest Bank and GazaWorldYemen, Rep.ZambiaZimbabwe línea de tiempo (timeline):
En esta escala de tiempo se presenta un gráfico de 1974 y 2013 de Euro area. Los datos de 1973 están ausentes. El número de observaciones reales por fecha: 34.
Fuente (nombre):
Indicadores del desarrollo mundial
Fuente (organización):
International Monetary Fund, Government Finance Statistics Yearbook and data files.
Categorías:
Public Sector
Se ha actualizado:
23 abr 2017 año
Los indicadores de los cambios de valor en los últimos años
Mínimo:
6.437
1 ene 1998 año
Máximo:
11.42
1 ene 2013 año
A la fecha de observación
Valor
Cambio absoluto
El cambio con respecto al valor anterior
1 ene 1974 año
7.355
+7.355
0.0%
1 ene 1975 año
6.666
-0.689
-9.37%
1 ene 1976 año
7.781
+1.115
16.72%
1 ene 1977 año
6.854
-0.927
-11.92%
1 ene 1978 año
7.725
+0.872
12.72%
1 ene 1979 año
8.114
+0.389
5.03%
1 ene 1980 año
8.904
+0.79
9.73%
1 ene 1981 año
8.87
-0.033
-0.37%
1 ene 1982 año
9.518
+0.648
7.3%
1 ene 1983 año
9.565
+0.047
0.5%
1 ene 1984 año
9.294
-0.271
-2.84%
1 ene 1985 año
9.372
+0.078
0.84%
1 ene 1986 año
9.252
-0.12
-1.28%
1 ene 1987 año
9.845
+0.592
6.4%
1 ene 1988 año
10.127
+0.282
2.87%
1 ene 1989 año
9.024
-1.103
-10.89%
1 ene 1990 año
9.023
-0.001
-0.01%
1 ene 1991 año
9.282
+0.259
2.87%
1 ene 1992 año
8.54
-0.742
-7.99%
1 ene 1993 año
9.237
+0.697
8.16%
1 ene 1994 año
8.99
-0.247
-2.68%
1 ene 1995 año
7.891
-1.099
-12.22%
1 ene 1996 año
7.748
-0.142
-1.8%
1 ene 1997 año
7.384
-0.365
-4.71%
1 ene 1998 año
6.437
-0.947
-12.82%
1 ene 1999 año
6.506
+0.069
1.07%
1 ene 2000 año
6.684
+0.178
2.73%
1 ene 2001 año
7.106
+0.422
6.32%
1 ene 2002 año
7.834
+0.728
10.24%
1 ene 2003 año
7.688
-0.146
-1.87%
1 ene 2004 año
7.763
+0.076
0.99%
1 ene 2011 año
9.859
+2.096
27.0%
1 ene 2012 año
10.81
+0.95
9.64%
1 ene 2013 año
11.42
+0.61
5.65%
Ranking de los países por los datos estadísticos actuales


Comentarios: