29
/es/
es
AIzaSyAYiBZKx7MnpbEhh9jyipgxe19OcubqV5w
April 1, 2024
28695
East Asia & Pacific (excluding high income)
EAP
false
2
1
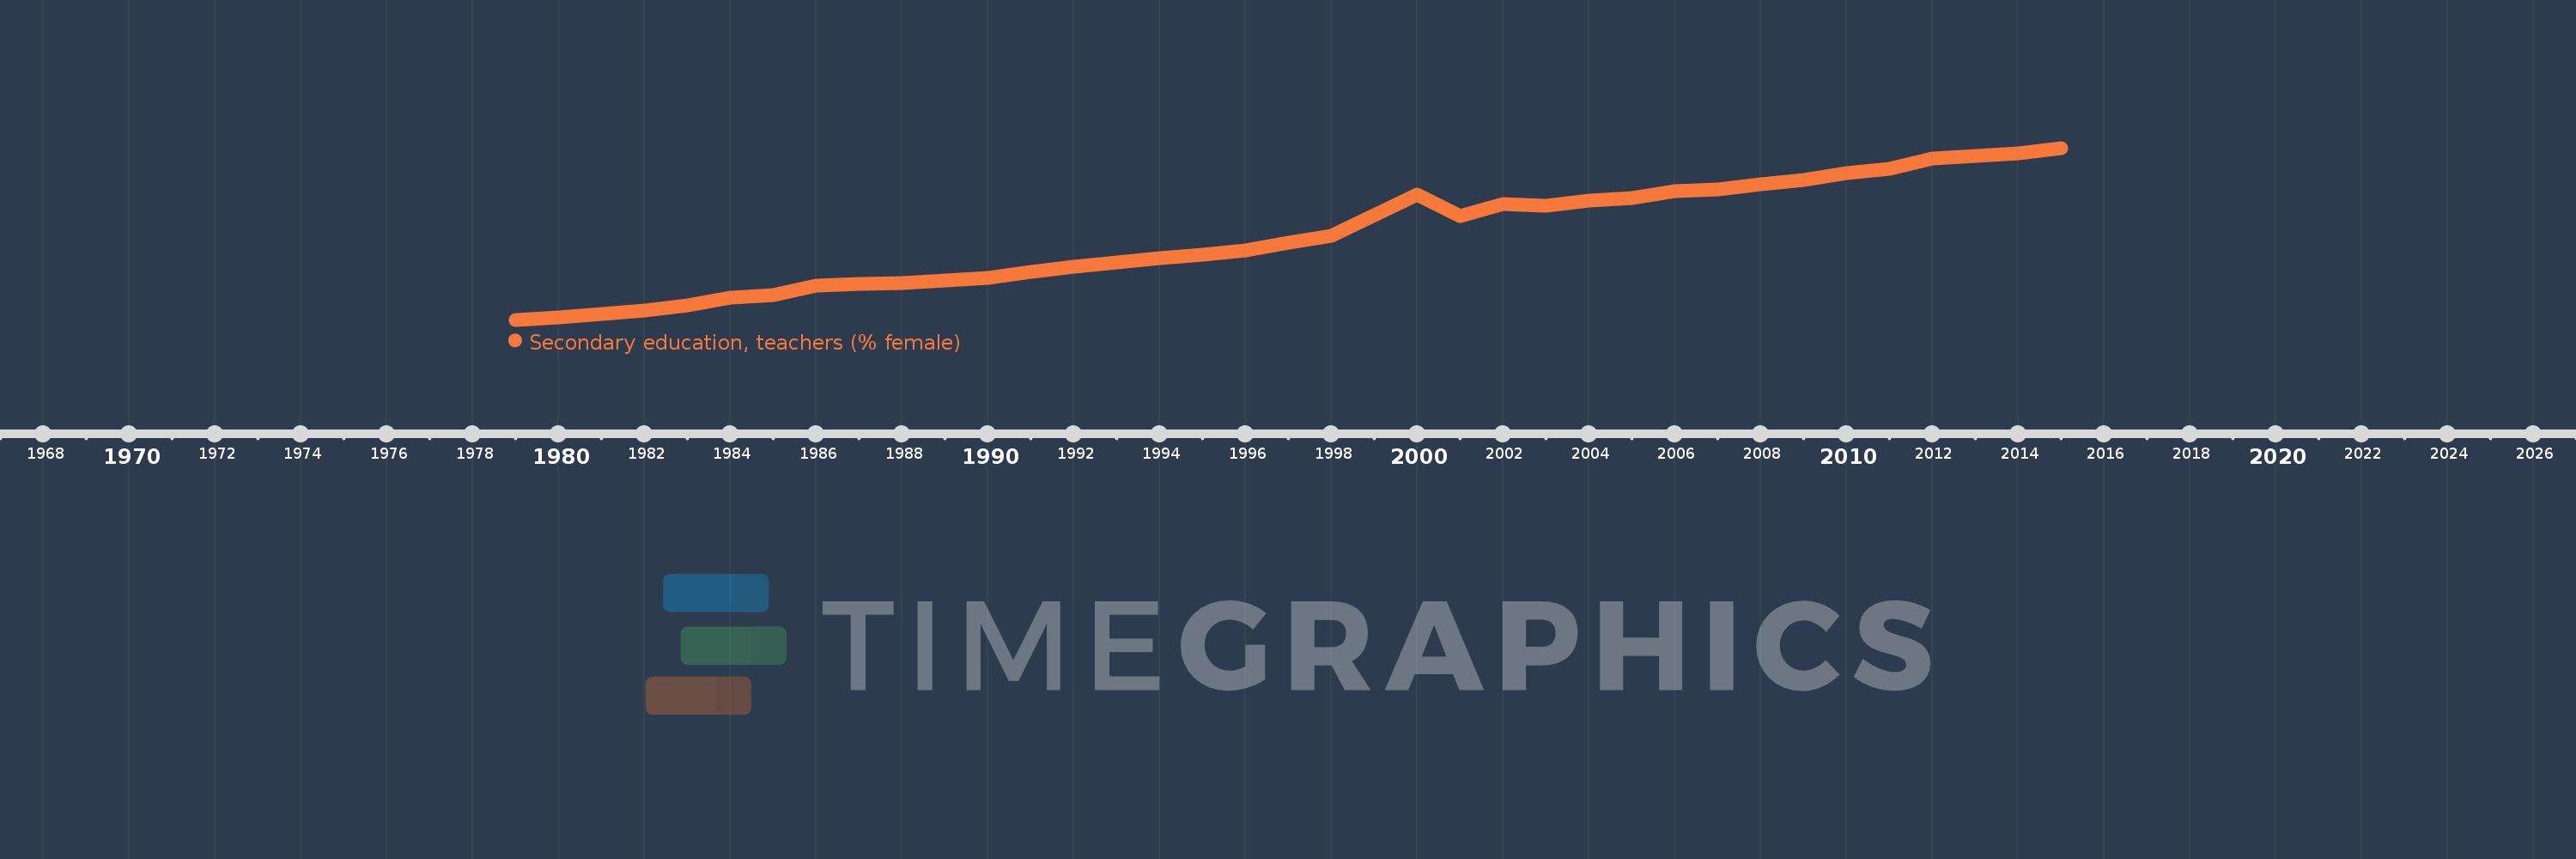
Secondary education, teachers (% female)
2015,2014,2013,2012,2011,2010,2009,2008,2007,2006,2005,2004,2003,2002,2001,2000,1999,1998,1997,1996,1995,1994,1993,1992,1991,1990,1989,1988,1987,1986,1985,1984,1983,1982,1981,1980,1979
Estas estadísticas en otros países:
AfghanistanAlbaniaAlgeriaAndorraAngolaAntigua and BarbudaArab WorldArgentinaArmeniaArubaAustraliaAustriaBahamas, TheBahrainBangladeshBarbadosBelarusBelgiumBelizeBeninBermudaBhutanBoliviaBosnia and HerzegovinaBotswanaBrazilBritish Virgin IslandsBrunei DarussalamBulgariaBurkina FasoBurundiCabo VerdeCambodiaCameroonCanadaCaribbean small statesCayman IslandsCentral African RepublicCentral Europe and the BalticsChadChileChinaColombiaComorosCongo, Dem. Rep.Congo, Rep.Costa RicaCote d'IvoireCroatiaCubaCyprusCzech RepublicDenmarkDjiboutiDominicaDominican RepublicEarly-demographic dividendEast Asia & PacificEast Asia & Pacific (excluding high income)East Asia & Pacific (IDA & IBRD countries)EcuadorEgypt, Arab Rep.El SalvadorEquatorial GuineaEritreaEstoniaEthiopiaEuro areaEurope & Central AsiaEurope & Central Asia (excluding high income)Europe & Central Asia (IDA & IBRD countries)European UnionFijiFinlandFragile and conflict affected situationsFranceGabonGambia, TheGeorgiaGermanyGhanaGibraltarGreeceGrenadaGuatemalaGuineaGuinea-BissauGuyanaHeavily indebted poor countries (HIPC)High incomeHondurasHong Kong SAR, ChinaHungaryIBRD onlyIcelandIDA & IBRD totalIDA blendIDA onlyIDA totalIndiaIndonesiaIran, Islamic Rep.IraqIrelandIsraelItalyJamaicaJapanJordanKazakhstanKenyaKiribatiKorea, Dem. People’s Rep.Korea, Rep.KuwaitKyrgyz RepublicLao PDRLate-demographic dividendLatin America & Caribbean Latin America & Caribbean (excluding high income)Latin America & the Caribbean (IDA & IBRD countries)LatviaLeast developed countries: UN classificationLebanonLesothoLiberiaLibyaLiechtensteinLithuaniaLow & middle incomeLow incomeLower middle incomeLuxembourgMacao SAR, ChinaMacedonia, FYRMadagascarMalawiMalaysiaMaldivesMaliMaltaMarshall IslandsMauritaniaMauritiusMexicoMiddle East & North AfricaMiddle East & North Africa (excluding high income)Middle East & North Africa (IDA & IBRD countries)Middle incomeMoldovaMonacoMongoliaMoroccoMozambiqueMyanmarNamibiaNauruNepalNetherlandsNew ZealandNicaraguaNigerNigeriaNorth AmericaNorwayOECD membersOmanOther small statesPacific island small statesPakistanPalauPanamaPapua New GuineaParaguayPeruPhilippinesPolandPortugalPost-demographic dividendPre-demographic dividendPuerto RicoQatarRomaniaRussian FederationRwandaSamoaSan MarinoSao Tome and PrincipeSaudi ArabiaSenegalSerbiaSeychellesSierra LeoneSingaporeSint Maarten (Dutch part)Slovak RepublicSloveniaSmall statesSolomon IslandsSomaliaSouth AfricaSouth AsiaSouth Asia (IDA & IBRD)SpainSri LankaSt. Kitts and NevisSt. LuciaSt. Vincent and the GrenadinesSub-Saharan Africa Sub-Saharan Africa (excluding high income)Sub-Saharan Africa (IDA & IBRD countries)SudanSurinameSwazilandSwedenSwitzerlandSyrian Arab RepublicTajikistanTanzaniaThailandTimor-LesteTogoTongaTrinidad and TobagoTunisiaTurkeyTurks and Caicos IslandsUgandaUkraineUnited Arab EmiratesUnited KingdomUnited StatesUpper middle incomeUruguayUzbekistanVanuatuVenezuela, RBVietnamWest Bank and GazaWorldYemen, Rep.ZambiaZimbabwe línea de tiempo (timeline):
En esta escala de tiempo se presenta un gráfico de 1979 y 2015 de East Asia & Pacific (excluding high income). Los datos de 1978 están ausentes. El número de observaciones reales por fecha: 37.
Fuente (nombre):
Indicadores del desarrollo mundial
Fuente (organización):
United Nations Educational, Scientific, and Cultural Organization (UNESCO) Institute for Statistics.
Categorías:
Education, Gender
Se ha actualizado:
23 abr 2017 año
Los indicadores de los cambios de valor en los últimos años
Mínimo:
28.717
1 ene 1979 año
Máximo:
53.118
1 ene 2015 año
A la fecha de observación
Valor
Cambio absoluto
El cambio con respecto al valor anterior
1 ene 1979 año
28.717
+28.717
0.0%
1 ene 1980 año
29.075
+0.358
1.25%
1 ene 1981 año
29.587
+0.512
1.76%
1 ene 1982 año
30.0
+0.413
1.4%
1 ene 1983 año
30.779
+0.779
2.6%
1 ene 1984 año
31.846
+1.067
3.47%
1 ene 1985 año
32.206
+0.36
1.13%
1 ene 1986 año
33.532
+1.326
4.12%
1 ene 1987 año
33.752
+0.22
0.66%
1 ene 1988 año
33.954
+0.201
0.6%
1 ene 1989 año
34.285
+0.332
0.98%
1 ene 1990 año
34.676
+0.39
1.14%
1 ene 1991 año
35.508
+0.832
2.4%
1 ene 1992 año
36.185
+0.677
1.91%
1 ene 1993 año
36.891
+0.707
1.95%
1 ene 1994 año
37.439
+0.548
1.48%
1 ene 1995 año
38.013
+0.574
1.53%
1 ene 1996 año
38.578
+0.564
1.48%
1 ene 1997 año
39.635
+1.058
2.74%
1 ene 1998 año
40.694
+1.059
2.67%
1 ene 1999 año
43.523
+2.829
6.95%
1 ene 2000 año
46.492
+2.969
6.82%
1 ene 2001 año
43.497
-2.995
-6.44%
1 ene 2002 año
45.091
+1.594
3.66%
1 ene 2003 año
44.968
-0.123
-0.27%
1 ene 2004 año
45.667
+0.699
1.55%
1 ene 2005 año
45.954
+0.288
0.63%
1 ene 2006 año
46.955
+1.0
2.18%
1 ene 2007 año
47.201
+0.246
0.52%
1 ene 2008 año
47.989
+0.788
1.67%
1 ene 2009 año
48.61
+0.621
1.29%
1 ene 2010 año
49.497
+0.887
1.82%
1 ene 2011 año
50.198
+0.701
1.42%
1 ene 2012 año
51.632
+1.435
2.86%
1 ene 2013 año
52.033
+0.401
0.78%
1 ene 2014 año
52.404
+0.371
0.71%
1 ene 2015 año
53.118
+0.714
1.36%
Ranking de los países por los datos estadísticos actuales


Comentarios: