29
/es/
es
AIzaSyAYiBZKx7MnpbEhh9jyipgxe19OcubqV5w
April 1, 2024
28538
East Asia & Pacific (excluding high income)
EAP
false
2
1
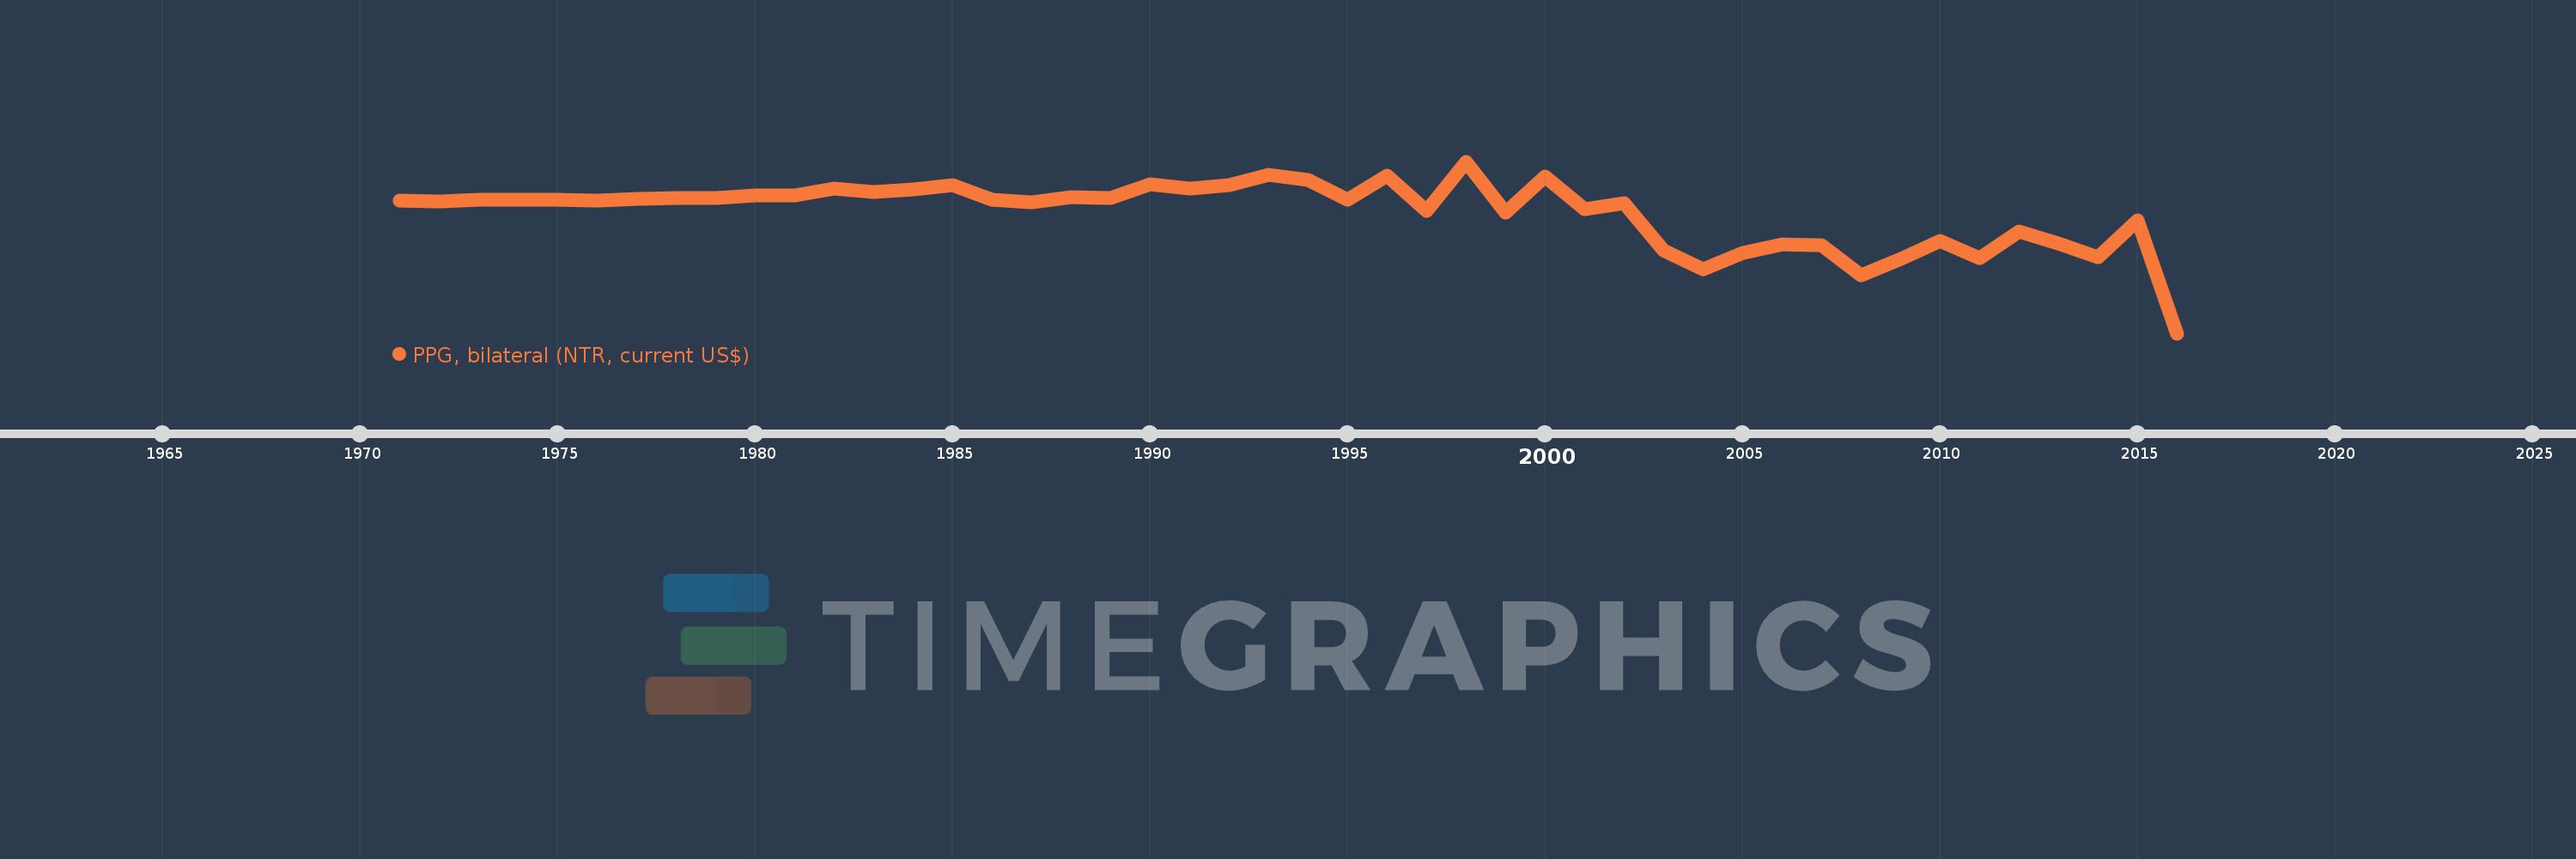
PPG, bilateral (NTR, current US$)
2016,2015,2014,2013,2012,2011,2010,2009,2008,2007,2006,2005,2004,2003,2002,2001,2000,1999,1998,1997,1996,1995,1994,1993,1992,1991,1990,1989,1988,1987,1986,1985,1984,1983,1982,1981,1980,1979,1978,1977,1976,1975,1974,1973,1972,1971
Estas estadísticas en otros países:
línea de tiempo (timeline):
En esta escala de tiempo se presenta un gráfico de 1971 y 2016 de East Asia & Pacific (excluding high income). Los datos de 1970 están ausentes. El número de observaciones reales por fecha: 46.
Fuente (nombre):
Indicadores del desarrollo mundial
Fuente (organización):
World Bank, International Debt Statistics.
Categorías:
External Debt
Se ha actualizado:
23 abr 2017 año
Los indicadores de los cambios de valor en los últimos años
En promedio:
-873.25 millones
Mínimo:
-13.577 bn
1 ene 2016 año
Máximo:
4.523 bn
1 ene 1998 año
A la fecha de observación
Valor
Cambio absoluto
El cambio con respecto al valor anterior
1 ene 1971 año
385.337 millones
+385.337 millones
0.0%
1 ene 1972 año
295.315 millones
-90.022 millones
-23.36%
1 ene 1973 año
479.31 millones
+183.995 millones
62.3%
1 ene 1974 año
476.667 millones
-2.643 millones
-0.55%
1 ene 1975 año
451.177 millones
-25.49 millones
-5.35%
1 ene 1976 año
385.856 millones
-65.321 millones
-14.48%
1 ene 1977 año
566.286 millones
+180.43 millones
46.76%
1 ene 1978 año
713.674 millones
+147.388 millones
26.03%
1 ene 1979 año
710.987 millones
-2.687 millones
-0.38%
1 ene 1980 año
948.648 millones
+237.661 millones
33.43%
1 ene 1981 año
939.307 millones
-9.341 millones
-0.98%
1 ene 1982 año
1.656 bn
+716.78 millones
76.31%
1 ene 1983 año
1.285 bn
-370.72 millones
-22.39%
1 ene 1984 año
1.597 bn
+311.156 millones
24.21%
1 ene 1985 año
2.044 bn
+447.851 millones
28.05%
1 ene 1986 año
499.489 millones
-1.545 bn
-75.57%
1 ene 1987 año
263.35 millones
-236.139 millones
-47.28%
1 ene 1988 año
795.852 millones
+532.502 millones
202.2%
1 ene 1989 año
678.932 millones
-116.92 millones
-14.69%
1 ene 1990 año
2.138 bn
+1.459 bn
214.84%
1 ene 1991 año
1.7 bn
-437.732 millones
-20.48%
1 ene 1992 año
2.044 bn
+344.32 millones
20.26%
1 ene 1993 año
3.165 bn
+1.121 bn
54.82%
1 ene 1994 año
2.573 bn
-591.961 millones
-18.71%
1 ene 1995 año
493.226 millones
-2.08 bn
-80.83%
1 ene 1996 año
3.028 bn
+2.535 bn
513.99%
1 ene 1997 año
-716.298 millones
-3.745 bn
-123.65%
1 ene 1998 año
4.523 bn
+5.239 bn
-731.4%
1 ene 1999 año
-900.833 millones
-5.424 bn
-119.92%
1 ene 2000 año
2.898 bn
+3.799 bn
-421.75%
1 ene 2001 año
-525.723 millones
-3.424 bn
-118.14%
1 ene 2002 año
93.597 millones
+619.32 millones
-117.8%
1 ene 2003 año
-4.801 bn
-4.895 bn
-5.23 mil%
1 ene 2004 año
-6.802 bn
-2.001 bn
41.67%
1 ene 2005 año
-5.141 bn
+1.66 bn
-24.41%
1 ene 2006 año
-4.223 bn
+918.76 millones
-17.87%
1 ene 2007 año
-4.303 bn
-80.707 millones
1.91%
1 ene 2008 año
-7.506 bn
-3.202 bn
74.42%
1 ene 2009 año
-5.76 bn
+1.746 bn
-23.26%
1 ene 2010 año
-3.808 bn
+1.952 bn
-33.89%
1 ene 2011 año
-5.659 bn
-1.851 bn
48.6%
1 ene 2012 año
-2.869 bn
+2.789 bn
-49.3%
1 ene 2013 año
-4.127 bn
-1.258 bn
43.86%
1 ene 2014 año
-5.603 bn
-1.476 bn
35.75%
1 ene 2015 año
-1.676 bn
+3.927 bn
-70.09%
1 ene 2016 año
-13.577 bn
-11.901 bn
710.28%
Ranking de los países por los datos estadísticos actuales


Comentarios: