29
/es/
es
AIzaSyAYiBZKx7MnpbEhh9jyipgxe19OcubqV5w
April 1, 2024
28509
East Asia & Pacific (excluding high income)
EAP
false
2
1
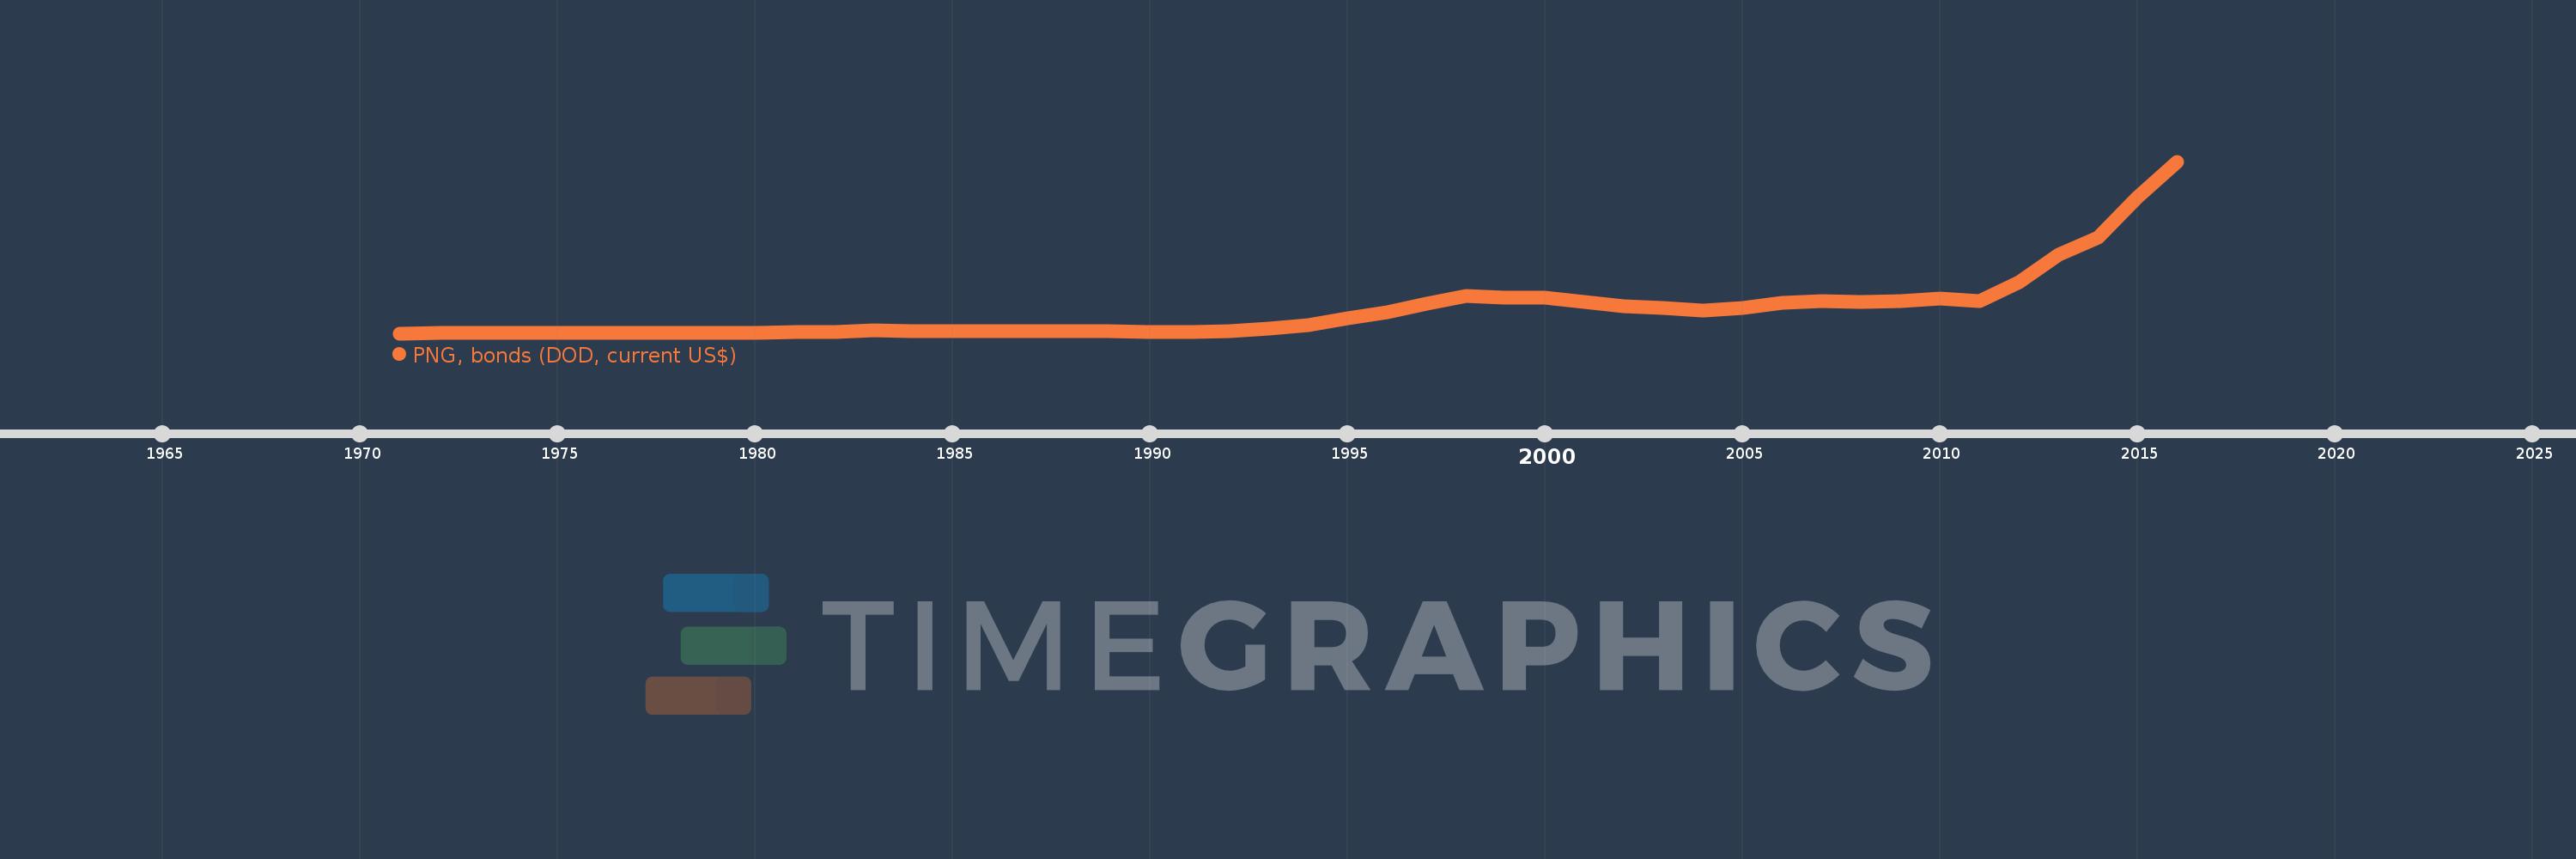
PNG, bonds (DOD, current US$)
2016,2015,2014,2013,2012,2011,2010,2009,2008,2007,2006,2005,2004,2003,2002,2001,2000,1999,1998,1997,1996,1995,1994,1993,1992,1991,1990,1989,1988,1987,1986,1985,1984,1983,1982,1981,1980,1979,1978,1977,1976,1975,1974,1973,1972,1971
Estas estadísticas en otros países:
línea de tiempo (timeline):
En esta escala de tiempo se presenta un gráfico de 1971 y 2016 de East Asia & Pacific (excluding high income). Los datos de 1970 están ausentes. El número de observaciones reales por fecha: 46.
Fuente (nombre):
Indicadores del desarrollo mundial
Fuente (organización):
World Bank, International Debt Statistics.
Categorías:
External Debt
Se ha actualizado:
23 abr 2017 año
Los indicadores de los cambios de valor en los últimos años
Mínimo:
49.8 millones
1 ene 1971 año
Máximo:
203.727 bn
1 ene 2016 año
A la fecha de observación
Valor
Cambio absoluto
El cambio con respecto al valor anterior
1 ene 1971 año
49.8 millones
+49.8 millones
0.0%
1 ene 1972 año
80.0 millones
+30.2 millones
60.64%
1 ene 1973 año
129.8 millones
+49.8 millones
62.25%
1 ene 1974 año
163.9 millones
+34.1 millones
26.27%
1 ene 1975 año
246.5 millones
+82.6 millones
50.4%
1 ene 1976 año
501.7 millones
+255.2 millones
103.53%
1 ene 1977 año
661.4 millones
+159.7 millones
31.83%
1 ene 1978 año
822.7 millones
+161.3 millones
24.39%
1 ene 1979 año
813.5 millones
-9.2 millones
-1.12%
1 ene 1980 año
998.0 millones
+184.5 millones
22.68%
1 ene 1981 año
1.248 bn
+250.252 millones
25.08%
1 ene 1982 año
1.637 bn
+388.815 millones
31.15%
1 ene 1983 año
3.198 bn
+1.561 bn
95.37%
1 ene 1984 año
2.731 bn
-466.9 millones
-14.6%
1 ene 1985 año
2.775 bn
+43.739 millones
1.6%
1 ene 1986 año
2.96 bn
+185.049 millones
6.67%
1 ene 1987 año
2.891 bn
-69.265 millones
-2.34%
1 ene 1988 año
2.61 bn
-281.0 millones
-9.72%
1 ene 1989 año
2.34 bn
-270.04 millones
-10.35%
1 ene 1990 año
1.41 bn
-929.87 millones
-39.74%
1 ene 1991 año
1.99 bn
+579.412 millones
41.09%
1 ene 1992 año
3.038 bn
+1.048 bn
52.69%
1 ene 1993 año
5.289 bn
+2.251 bn
74.11%
1 ene 1994 año
9.827 bn
+4.538 bn
85.8%
1 ene 1995 año
18.071 bn
+8.244 bn
83.9%
1 ene 1996 año
24.855 bn
+6.784 bn
37.54%
1 ene 1997 año
34.827 bn
+9.972 bn
40.12%
1 ene 1998 año
44.239 bn
+9.412 bn
27.02%
1 ene 1999 año
42.572 bn
-1.667 bn
-3.77%
1 ene 2000 año
42.279 bn
-292.757 millones
-0.69%
1 ene 2001 año
36.742 bn
-5.538 bn
-13.1%
1 ene 2002 año
31.998 bn
-4.744 bn
-12.91%
1 ene 2003 año
29.721 bn
-2.277 bn
-7.12%
1 ene 2004 año
26.94 bn
-2.782 bn
-9.36%
1 ene 2005 año
29.594 bn
+2.655 bn
9.85%
1 ene 2006 año
36.242 bn
+6.648 bn
22.46%
1 ene 2007 año
37.756 bn
+1.514 bn
4.18%
1 ene 2008 año
37.698 bn
-58.659 millones
-0.16%
1 ene 2009 año
37.756 bn
+58.368 millones
0.15%
1 ene 2010 año
41.046 bn
+3.29 bn
8.71%
1 ene 2011 año
37.857 bn
-3.189 bn
-7.77%
1 ene 2012 año
60.548 bn
+22.69 bn
59.94%
1 ene 2013 año
93.304 bn
+32.757 bn
54.1%
1 ene 2014 año
113.805 bn
+20.501 bn
21.97%
1 ene 2015 año
161.379 bn
+47.574 bn
41.8%
1 ene 2016 año
203.727 bn
+42.348 bn
26.24%
Ranking de los países por los datos estadísticos actuales


Comentarios: