29
/es/
es
AIzaSyAYiBZKx7MnpbEhh9jyipgxe19OcubqV5w
April 1, 2024
280240
Vanuatu
VUT
true
2
1
PPG, bilateral concessional (INT, current US$)
2016,2015,2014,2013,2012,2011,2010,2009,2008,2007,2006,2005,2004,2003,2002,2001,2000,1999,1998,1997,1996,1995,1994,1993,1992,1991,1990,1989,1988,1987,1986,1985,1984,1983,1982
Estas estadísticas en otros países:
línea de tiempo (timeline):
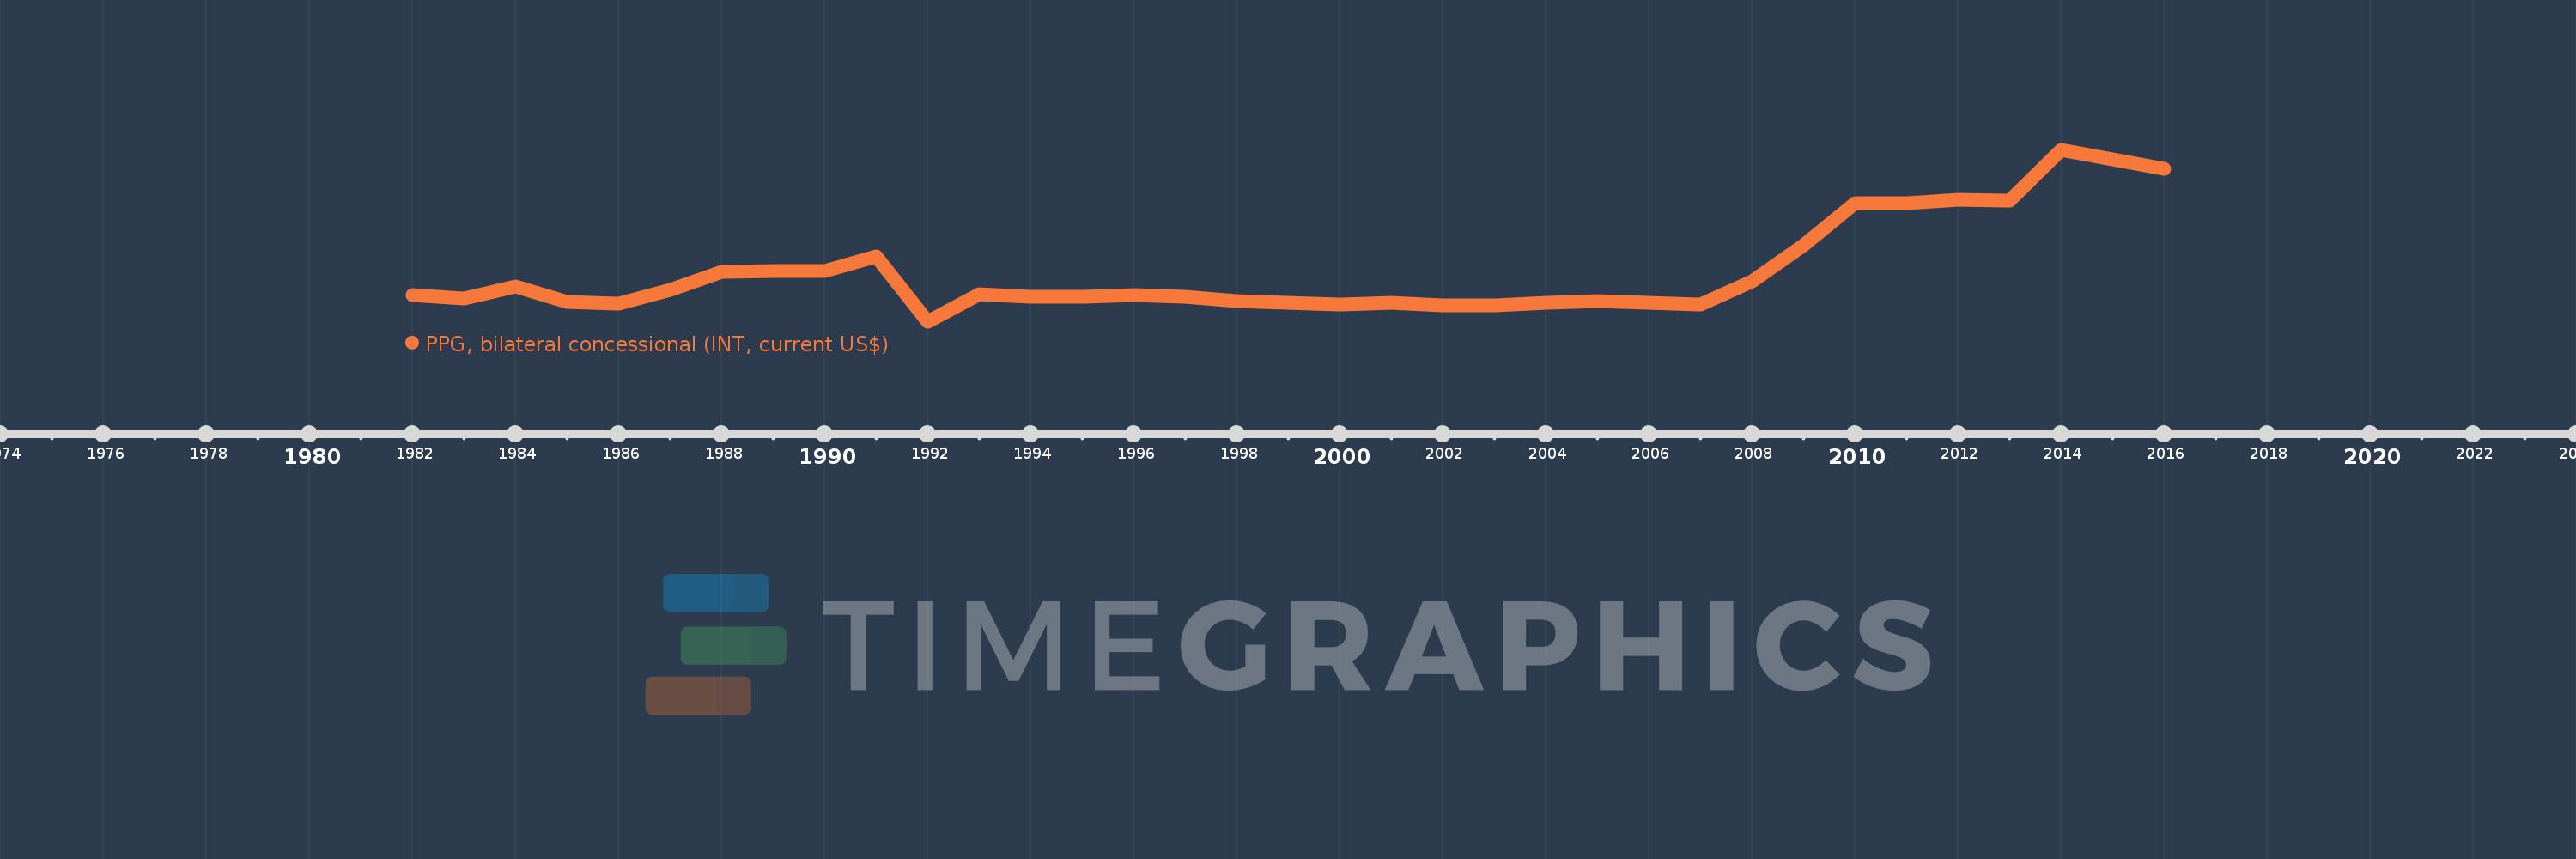
En esta escala de tiempo se presenta un gráfico de 1982 y 2016 de Vanuatu. Los datos de 1981 están ausentes. El número de observaciones reales por fecha: 35.
Fuente (nombre):
Indicadores del desarrollo mundial
Fuente (organización):
World Bank, International Debt Statistics.
Categorías:
External Debt
Se ha actualizado:
23 abr 2017 año
Los indicadores de los cambios de valor en los últimos años
Mínimo:
11.0 mil
1 ene 1992 año
Máximo:
822.0 mil
1 ene 2014 año
A la fecha de observación
Valor
Cambio absoluto
El cambio con respecto al valor anterior
1 ene 1982 año
136.0 mil
+136.0 mil
0.0%
1 ene 1983 año
122.0 mil
-14.0 mil
-10.29%
1 ene 1984 año
179.0 mil
+57.0 mil
46.72%
1 ene 1985 año
105.0 mil
-74.0 mil
-41.34%
1 ene 1986 año
99.0 mil
-6.0 mil
-5.71%
1 ene 1987 año
164.0 mil
+65.0 mil
65.66%
1 ene 1988 año
248.0 mil
+84.0 mil
51.22%
1 ene 1989 año
252.0 mil
+4.0 mil
1.61%
1 ene 1990 año
251.0 mil
-1000.0
-0.4%
1 ene 1991 año
319.0 mil
+68.0 mil
27.09%
1 ene 1992 año
11.0 mil
-308.0 mil
-96.55%
1 ene 1993 año
140.0 mil
+129.0 mil
1.17 mil%
1 ene 1994 año
129.0 mil
-11.0 mil
-7.86%
1 ene 1995 año
129.0 mil
0.0
0.0%
1 ene 1996 año
139.0 mil
+10.0 mil
7.75%
1 ene 1997 año
129.0 mil
-10.0 mil
-7.19%
1 ene 1998 año
109.0 mil
-20.0 mil
-15.5%
1 ene 1999 año
102.0 mil
-7.0 mil
-6.42%
1 ene 2000 año
94.0 mil
-8.0 mil
-7.84%
1 ene 2001 año
102.0 mil
+8.0 mil
8.51%
1 ene 2002 año
91.0 mil
-11.0 mil
-10.78%
1 ene 2003 año
90.0 mil
-1000.0
-1.1%
1 ene 2004 año
101.0 mil
+11.0 mil
12.22%
1 ene 2005 año
109.0 mil
+8.0 mil
7.92%
1 ene 2006 año
100.0 mil
-9.0 mil
-8.26%
1 ene 2007 año
94.0 mil
-6.0 mil
-6.0%
1 ene 2008 año
201.0 mil
+107.0 mil
113.83%
1 ene 2009 año
375.0 mil
+174.0 mil
86.57%
1 ene 2010 año
571.0 mil
+196.0 mil
52.27%
1 ene 2011 año
570.0 mil
-1000.0
-0.18%
1 ene 2012 año
588.0 mil
+18.0 mil
3.16%
1 ene 2013 año
584.0 mil
-4.0 mil
-0.68%
1 ene 2014 año
822.0 mil
+238.0 mil
40.75%
1 ene 2015 año
780.0 mil
-42.0 mil
-5.11%
1 ene 2016 año
736.0 mil
-44.0 mil
-5.64%
Ranking de los países por los datos estadísticos actuales


Comentarios: