29
/es/
es
AIzaSyAYiBZKx7MnpbEhh9jyipgxe19OcubqV5w
April 1, 2024
278198
Uruguay
URY
true
2
1
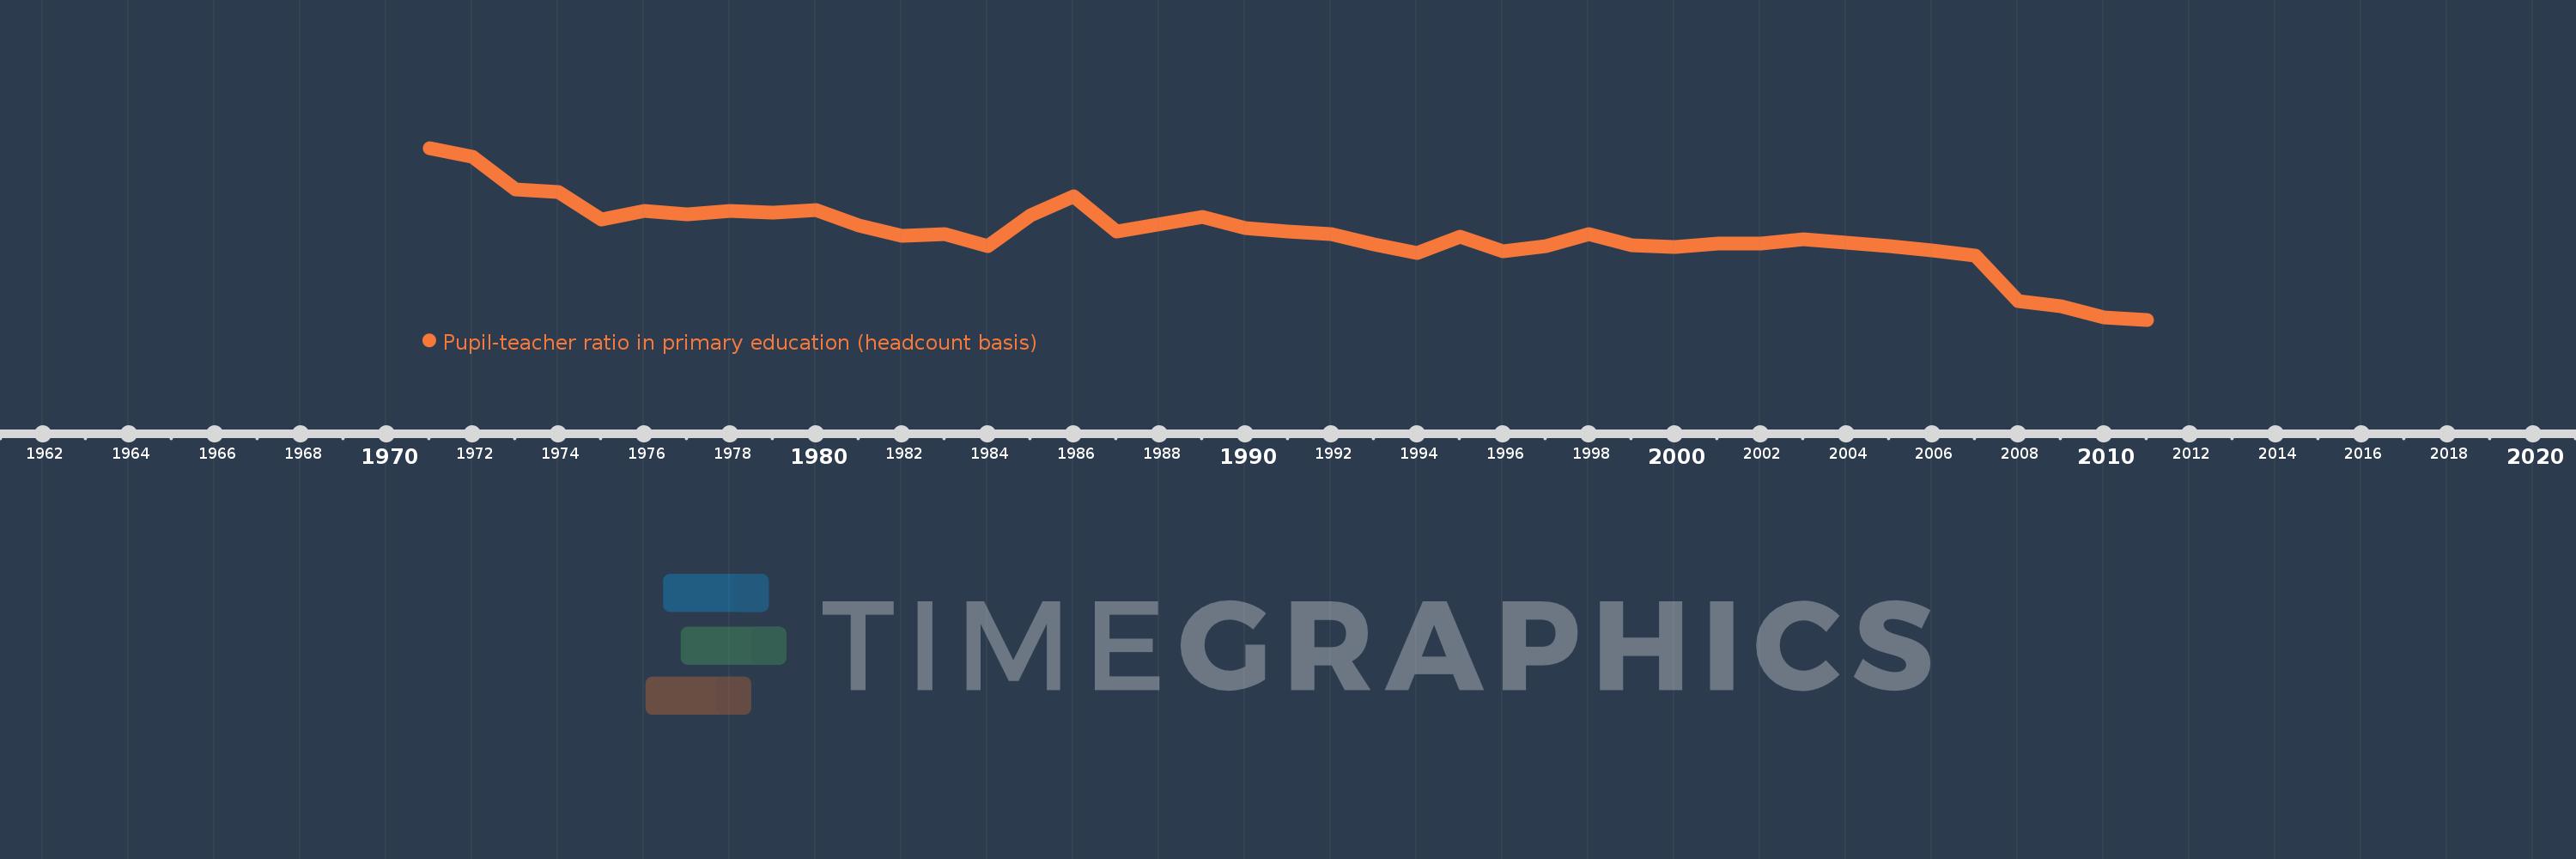
Pupil-teacher ratio in primary education (headcount basis)
2011,2010,2009,2008,2007,2006,2005,2004,2003,2002,2001,2000,1999,1998,1997,1996,1995,1994,1993,1992,1991,1990,1989,1987,1986,1985,1984,1983,1982,1981,1980,1979,1978,1977,1976,1975,1974,1973,1972,1971
Estas estadísticas en otros países:
AfghanistanAlbaniaAlgeriaAndorraAngolaAntigua and BarbudaArab WorldArgentinaArmeniaArubaAustraliaAustriaAzerbaijanBahamas, TheBahrainBangladeshBarbadosBelarusBelgiumBelizeBeninBermudaBhutanBoliviaBosnia and HerzegovinaBotswanaBrazilBritish Virgin IslandsBrunei DarussalamBulgariaBurkina FasoBurundiCabo VerdeCambodiaCameroonCanadaCaribbean small statesCayman IslandsCentral African RepublicCentral Europe and the BalticsChadChileChinaColombiaComorosCongo, Dem. Rep.Congo, Rep.Costa RicaCote d'IvoireCroatiaCubaCyprusCzech RepublicDenmarkDjiboutiDominicaDominican RepublicEarly-demographic dividendEast Asia & PacificEast Asia & Pacific (excluding high income)East Asia & Pacific (IDA & IBRD countries)EcuadorEgypt, Arab Rep.El SalvadorEquatorial GuineaEritreaEstoniaEthiopiaEuro areaEurope & Central AsiaEurope & Central Asia (excluding high income)Europe & Central Asia (IDA & IBRD countries)European UnionFijiFinlandFragile and conflict affected situationsFranceGabonGambia, TheGeorgiaGermanyGhanaGibraltarGreeceGrenadaGuatemalaGuineaGuinea-BissauGuyanaHaitiHeavily indebted poor countries (HIPC)High incomeHondurasHong Kong SAR, ChinaHungaryIBRD onlyIcelandIDA & IBRD totalIDA blendIDA onlyIDA totalIndiaIndonesiaIran, Islamic Rep.IraqIrelandIsraelItalyJamaicaJapanJordanKazakhstanKenyaKiribatiKorea, Dem. People’s Rep.Korea, Rep.KuwaitKyrgyz RepublicLao PDRLate-demographic dividendLatin America & Caribbean Latin America & Caribbean (excluding high income)Latin America & the Caribbean (IDA & IBRD countries)LatviaLeast developed countries: UN classificationLebanonLesothoLiberiaLibyaLiechtensteinLithuaniaLow & middle incomeLow incomeLower middle incomeLuxembourgMacao SAR, ChinaMacedonia, FYRMadagascarMalawiMalaysiaMaldivesMaliMaltaMarshall IslandsMauritaniaMauritiusMexicoMicronesia, Fed. Sts.Middle East & North AfricaMiddle East & North Africa (excluding high income)Middle East & North Africa (IDA & IBRD countries)Middle incomeMoldovaMonacoMongoliaMoroccoMozambiqueMyanmarNamibiaNauruNepalNetherlandsNew ZealandNicaraguaNigerNigeriaNorth AmericaNorwayOECD membersOmanOther small statesPacific island small statesPakistanPalauPanamaPapua New GuineaParaguayPeruPhilippinesPolandPortugalPost-demographic dividendPre-demographic dividendPuerto RicoQatarRomaniaRussian FederationRwandaSamoaSan MarinoSao Tome and PrincipeSaudi ArabiaSenegalSerbiaSeychellesSierra LeoneSingaporeSint Maarten (Dutch part)Slovak RepublicSloveniaSmall statesSolomon IslandsSomaliaSouth AfricaSouth AsiaSouth Asia (IDA & IBRD)South SudanSpainSri LankaSt. Kitts and NevisSt. LuciaSt. Vincent and the GrenadinesSub-Saharan Africa Sub-Saharan Africa (excluding high income)Sub-Saharan Africa (IDA & IBRD countries)SudanSurinameSwazilandSwedenSwitzerlandSyrian Arab RepublicTajikistanTanzaniaThailandTimor-LesteTogoTongaTrinidad and TobagoTunisiaTurkeyTurks and Caicos IslandsTuvaluUgandaUkraineUnited Arab EmiratesUnited KingdomUnited StatesUpper middle incomeUruguayUzbekistanVanuatuVenezuela, RBVietnamWest Bank and GazaWorldYemen, Rep.ZambiaZimbabwe línea de tiempo (timeline):
En esta escala de tiempo se presenta un gráfico de 1971 y 2011 de Uruguay. Los datos de 1970 están ausentes. El número de observaciones reales por fecha: 40.
Fuente (nombre):
Indicadores del desarrollo mundial
Fuente (organización):
UNESCO Institute for Statistics
Categorías:
Education
Se ha actualizado:
23 abr 2017 año
Los indicadores de los cambios de valor en los últimos años
Mínimo:
13.794
1 ene 2011 año
Máximo:
29.486
1 ene 1971 año
A la fecha de observación
Valor
Cambio absoluto
El cambio con respecto al valor anterior
1 ene 1971 año
29.486
+29.486
0.0%
1 ene 1972 año
28.65
-0.836
-2.84%
1 ene 1973 año
25.664
-2.986
-10.42%
1 ene 1974 año
25.428
-0.236
-0.92%
1 ene 1975 año
22.935
-2.493
-9.8%
1 ene 1976 año
23.77
+0.834
3.64%
1 ene 1977 año
23.422
-0.348
-1.46%
1 ene 1978 año
23.702
+0.28
1.2%
1 ene 1979 año
23.579
-0.123
-0.52%
1 ene 1980 año
23.816
+0.237
1.01%
1 ene 1981 año
22.43
-1.386
-5.82%
1 ene 1982 año
21.488
-0.942
-4.2%
1 ene 1983 año
21.591
+0.103
0.48%
1 ene 1984 año
20.555
-1.036
-4.8%
1 ene 1985 año
23.327
+2.771
13.48%
1 ene 1986 año
25.083
+1.756
7.53%
1 ene 1987 año
21.89
-3.193
-12.73%
1 ene 1989 año
23.175
+1.285
5.87%
1 ene 1990 año
22.14
-1.035
-4.47%
1 ene 1991 año
21.888
-0.253
-1.14%
1 ene 1992 año
21.642
-0.246
-1.12%
1 ene 1993 año
20.639
-1.003
-4.63%
1 ene 1994 año
19.905
-0.734
-3.56%
1 ene 1995 año
21.395
+1.49
7.49%
1 ene 1996 año
20.081
-1.314
-6.14%
1 ene 1997 año
20.487
+0.406
2.02%
1 ene 1998 año
21.595
+1.108
5.41%
1 ene 1999 año
20.61
-0.985
-4.56%
1 ene 2000 año
20.44
-0.171
-0.83%
1 ene 2001 año
20.757
+0.317
1.55%
1 ene 2002 año
20.775
+0.019
0.09%
1 ene 2003 año
21.17
+0.394
1.9%
1 ene 2004 año
20.825
-0.344
-1.63%
1 ene 2005 año
20.534
-0.291
-1.4%
1 ene 2006 año
20.152
-0.382
-1.86%
1 ene 2007 año
19.645
-0.507
-2.52%
1 ene 2008 año
15.51
-4.135
-21.05%
1 ene 2009 año
15.01
-0.5
-3.22%
1 ene 2010 año
13.986
-1.024
-6.82%
1 ene 2011 año
13.794
-0.192
-1.37%
Ranking de los países por los datos estadísticos actuales


Comentarios: