29
/es/
es
AIzaSyAYiBZKx7MnpbEhh9jyipgxe19OcubqV5w
April 1, 2024
271238
Turks and Caicos Islands
TCA
true
2
1
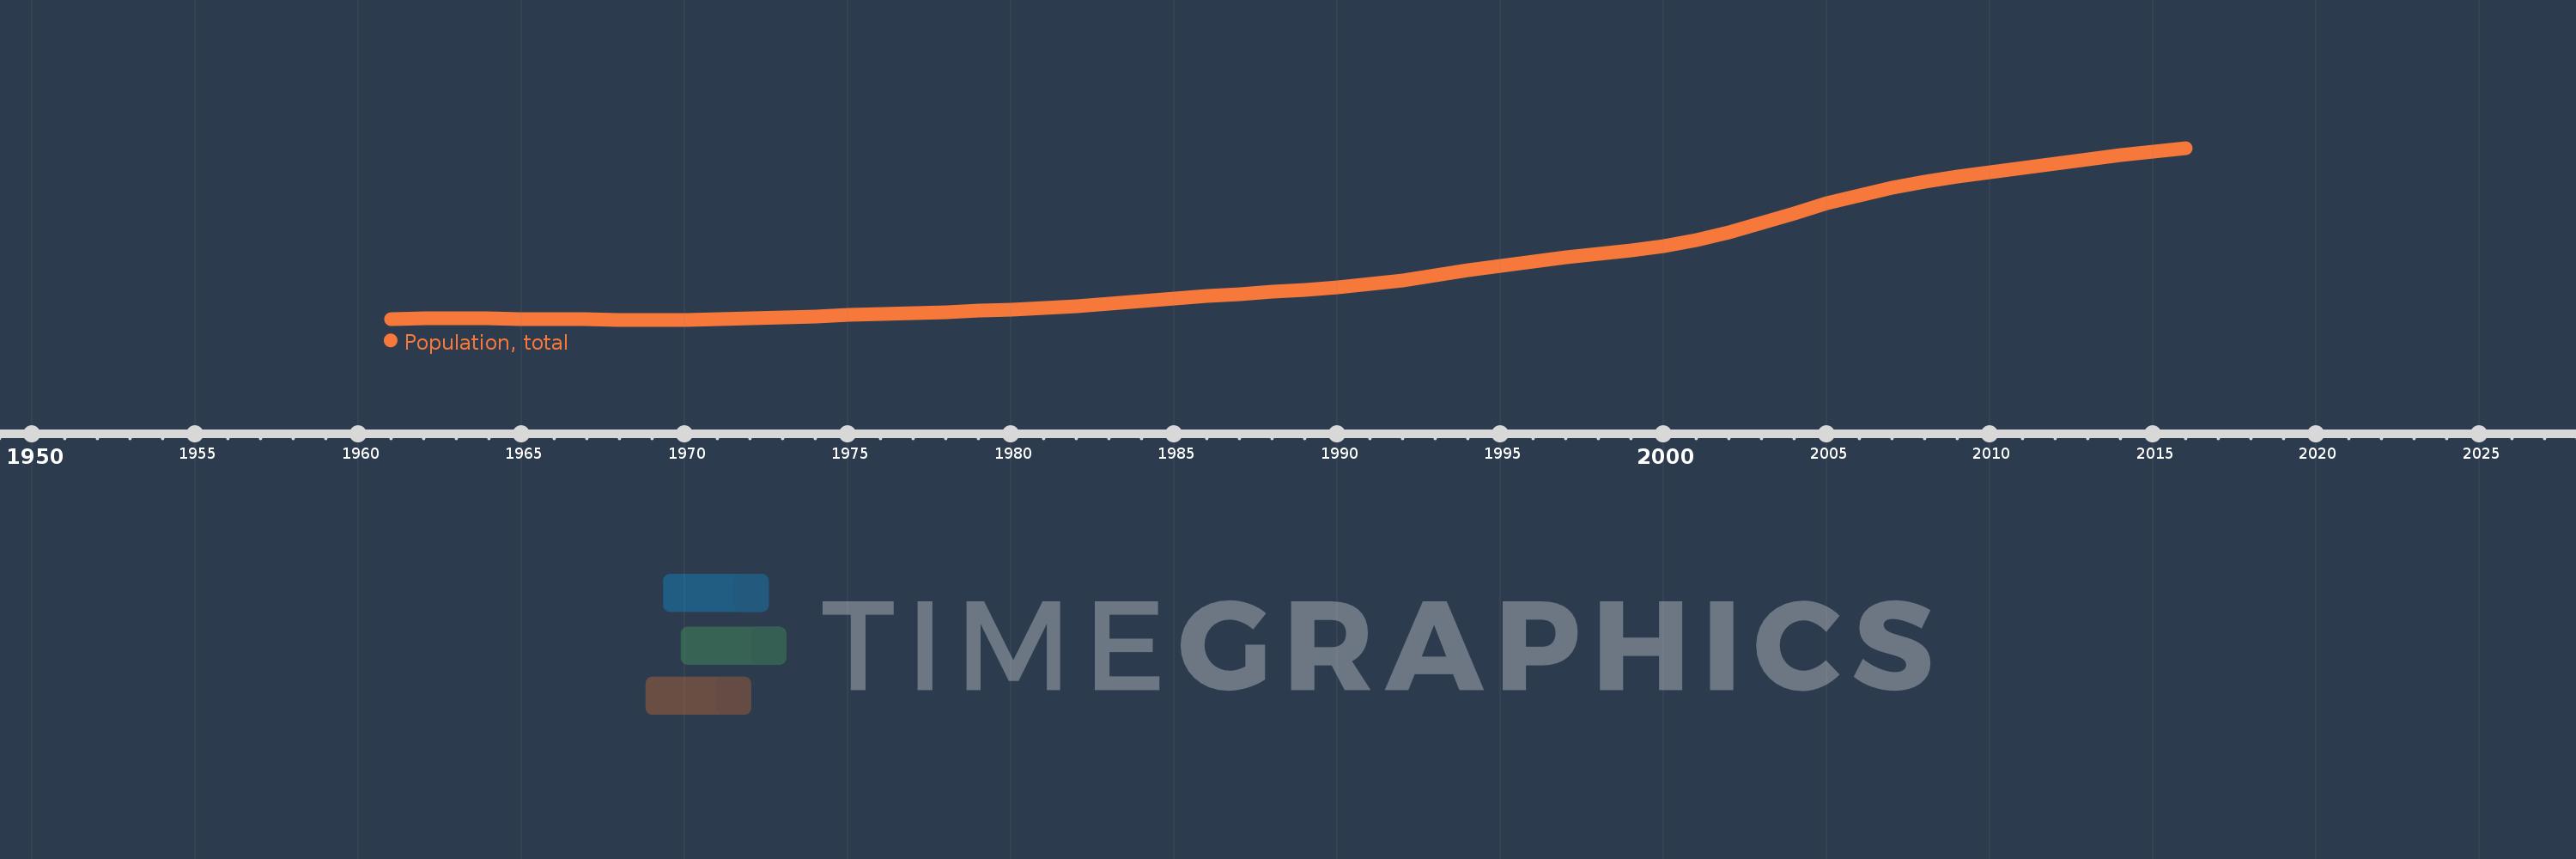
Population, total
2016,2015,2014,2013,2012,2011,2010,2009,2008,2007,2006,2005,2004,2003,2002,2001,2000,1999,1998,1997,1996,1995,1994,1993,1992,1991,1990,1989,1988,1987,1986,1985,1984,1983,1982,1981,1980,1979,1978,1977,1976,1975,1974,1973,1972,1971,1970,1969,1968,1967,1966,1965,1964,1963,1962,1961
Estas estadísticas en otros países:
AfghanistanAlbaniaAlgeriaAmerican SamoaAndorraAngolaAntigua and BarbudaArab WorldArgentinaArmeniaArubaAustraliaAustriaAzerbaijanBahamas, TheBahrainBangladeshBarbadosBelarusBelgiumBelizeBeninBermudaBhutanBoliviaBosnia and HerzegovinaBotswanaBrazilBritish Virgin IslandsBrunei DarussalamBulgariaBurkina FasoBurundiCabo VerdeCambodiaCameroonCanadaCaribbean small statesCayman IslandsCentral African RepublicCentral Europe and the BalticsChadChannel IslandsChileChinaColombiaComorosCongo, Dem. Rep.Congo, Rep.Costa RicaCote d'IvoireCroatiaCubaCuracaoCyprusCzech RepublicDenmarkDjiboutiDominicaDominican RepublicEarly-demographic dividendEast Asia & PacificEast Asia & Pacific (excluding high income)East Asia & Pacific (IDA & IBRD countries)EcuadorEgypt, Arab Rep.El SalvadorEquatorial GuineaEritreaEstoniaEthiopiaEuro areaEurope & Central AsiaEurope & Central Asia (excluding high income)Europe & Central Asia (IDA & IBRD countries)European UnionFaroe IslandsFijiFinlandFragile and conflict affected situationsFranceFrench PolynesiaGabonGambia, TheGeorgiaGermanyGhanaGibraltarGreeceGreenlandGrenadaGuamGuatemalaGuineaGuinea-BissauGuyanaHaitiHeavily indebted poor countries (HIPC)High incomeHondurasHong Kong SAR, ChinaHungaryIBRD onlyIcelandIDA & IBRD totalIDA blendIDA onlyIDA totalIndiaIndonesiaIran, Islamic Rep.IraqIrelandIsle of ManIsraelItalyJamaicaJapanJordanKazakhstanKenyaKiribatiKorea, Dem. People’s Rep.Korea, Rep.KosovoKuwaitKyrgyz RepublicLao PDRLate-demographic dividendLatin America & Caribbean Latin America & Caribbean (excluding high income)Latin America & the Caribbean (IDA & IBRD countries)LatviaLeast developed countries: UN classificationLebanonLesothoLiberiaLibyaLiechtensteinLithuaniaLow & middle incomeLow incomeLower middle incomeLuxembourgMacao SAR, ChinaMacedonia, FYRMadagascarMalawiMalaysiaMaldivesMaliMaltaMarshall IslandsMauritaniaMauritiusMexicoMicronesia, Fed. Sts.Middle East & North AfricaMiddle East & North Africa (excluding high income)Middle East & North Africa (IDA & IBRD countries)Middle incomeMoldovaMonacoMongoliaMontenegroMoroccoMozambiqueMyanmarNamibiaNauruNepalNetherlandsNew CaledoniaNew ZealandNicaraguaNigerNigeriaNorth AmericaNorthern Mariana IslandsNorwayOECD membersOmanOther small statesPacific island small statesPakistanPalauPanamaPapua New GuineaParaguayPeruPhilippinesPolandPortugalPost-demographic dividendPre-demographic dividendPuerto RicoQatarRomaniaRussian FederationRwandaSamoaSan MarinoSao Tome and PrincipeSaudi ArabiaSenegalSerbiaSeychellesSierra LeoneSingaporeSint Maarten (Dutch part)Slovak RepublicSloveniaSmall statesSolomon IslandsSomaliaSouth AfricaSouth AsiaSouth Asia (IDA & IBRD)South SudanSpainSri LankaSt. Kitts and NevisSt. LuciaSt. Martin (French part)St. Vincent and the GrenadinesSub-Saharan Africa Sub-Saharan Africa (excluding high income)Sub-Saharan Africa (IDA & IBRD countries)SudanSurinameSwazilandSwedenSwitzerlandSyrian Arab RepublicTajikistanTanzaniaThailandTimor-LesteTogoTongaTrinidad and TobagoTunisiaTurkeyTurkmenistanTurks and Caicos IslandsTuvaluUgandaUkraineUnited Arab EmiratesUnited KingdomUnited StatesUpper middle incomeUruguayUzbekistanVanuatuVenezuela, RBVietnamVirgin Islands (U.S.)West Bank and GazaWorldYemen, Rep.ZambiaZimbabwe línea de tiempo (timeline):
En esta escala de tiempo se presenta un gráfico de 1961 y 2016 de Turks and Caicos Islands. Los datos de 1960 están ausentes. El número de observaciones reales por fecha: 56.
Fuente (nombre):
Indicadores del desarrollo mundial
Fuente (organización):
(1) United Nations Population Division. World Population Prospects, (2) Census reports and other statistical publications from national statistical offices, (3) Eurostat: Demographic Statistics, (4) United Nations Statistical Division. Population and Vital Statistics Report (various years), (5) U.S. Census Bureau: International Database, and (6) Secretariat of the Pacific Community: Statistics and Demography Programme.
Categorías:
Climate Change, Health
Se ha actualizado:
23 abr 2017 año
Los indicadores de los cambios de valor en los últimos años
Mínimo:
5.563 mil
1 ene 1969 año
Máximo:
34.339 mil
1 ene 2016 año
A la fecha de observación
Valor
Cambio absoluto
El cambio con respecto al valor anterior
1 ene 1961 año
5.724 mil
+5.724 mil
0.0%
1 ene 1962 año
5.76 mil
+36.0
0.63%
1 ene 1963 año
5.762 mil
+2.0
0.03%
1 ene 1964 año
5.741 mil
-21.0
-0.36%
1 ene 1965 año
5.705 mil
-36.0
-0.63%
1 ene 1966 año
5.669 mil
-36.0
-0.63%
1 ene 1967 año
5.629 mil
-40.0
-0.71%
1 ene 1968 año
5.589 mil
-40.0
-0.71%
1 ene 1969 año
5.563 mil
-26.0
-0.47%
1 ene 1970 año
5.573 mil
+10.0
0.18%
1 ene 1971 año
5.632 mil
+59.0
1.06%
1 ene 1972 año
5.75 mil
+118.0
2.1%
1 ene 1973 año
5.924 mil
+174.0
3.03%
1 ene 1974 año
6.132 mil
+208.0
3.51%
1 ene 1975 año
6.346 mil
+214.0
3.49%
1 ene 1976 año
6.546 mil
+200.0
3.15%
1 ene 1977 año
6.723 mil
+177.0
2.7%
1 ene 1978 año
6.886 mil
+163.0
2.42%
1 ene 1979 año
7.057 mil
+171.0
2.48%
1 ene 1980 año
7.262 mil
+205.0
2.9%
1 ene 1981 año
7.525 mil
+263.0
3.62%
1 ene 1982 año
7.855 mil
+330.0
4.39%
1 ene 1983 año
8.245 mil
+390.0
4.96%
1 ene 1984 año
8.671 mil
+426.0
5.17%
1 ene 1985 año
9.097 mil
+426.0
4.91%
1 ene 1986 año
9.502 mil
+405.0
4.45%
1 ene 1987 año
9.873 mil
+371.0
3.9%
1 ene 1988 año
10.224 mil
+351.0
3.56%
1 ene 1989 año
10.588 mil
+364.0
3.56%
1 ene 1990 año
11.019 mil
+431.0
4.07%
1 ene 1991 año
11.55 mil
+531.0
4.82%
1 ene 1992 año
12.205 mil
+655.0
5.67%
1 ene 1993 año
12.97 mil
+765.0
6.27%
1 ene 1994 año
13.793 mil
+823.0
6.35%
1 ene 1995 año
14.597 mil
+804.0
5.83%
1 ene 1996 año
15.334 mil
+737.0
5.05%
1 ene 1997 año
15.967 mil
+633.0
4.13%
1 ene 1998 año
16.527 mil
+560.0
3.51%
1 ene 1999 año
17.114 mil
+587.0
3.55%
1 ene 2000 año
17.866 mil
+752.0
4.39%
1 ene 2001 año
18.876 mil
+1.01 mil
5.65%
1 ene 2002 año
20.186 mil
+1.31 mil
6.94%
1 ene 2003 año
21.74 mil
+1.554 mil
7.7%
1 ene 2004 año
23.412 mil
+1.672 mil
7.69%
1 ene 2005 año
25.025 mil
+1.613 mil
6.89%
1 ene 2006 año
26.45 mil
+1.425 mil
5.69%
1 ene 2007 año
27.642 mil
+1.192 mil
4.51%
1 ene 2008 año
28.638 mil
+996.0
3.6%
1 ene 2009 año
29.481 mil
+843.0
2.94%
1 ene 2010 año
30.247 mil
+766.0
2.6%
1 ene 2011 año
30.993 mil
+746.0
2.47%
1 ene 2012 año
31.727 mil
+734.0
2.37%
1 ene 2013 año
32.43 mil
+703.0
2.22%
1 ene 2014 año
33.103 mil
+673.0
2.08%
1 ene 2015 año
33.74 mil
+637.0
1.92%
1 ene 2016 año
34.339 mil
+599.0
1.78%
Ranking de los países por los datos estadísticos actuales


Comentarios: