29
/es/
es
AIzaSyAYiBZKx7MnpbEhh9jyipgxe19OcubqV5w
April 1, 2024
270046
Turkey
TUR
true
2
1
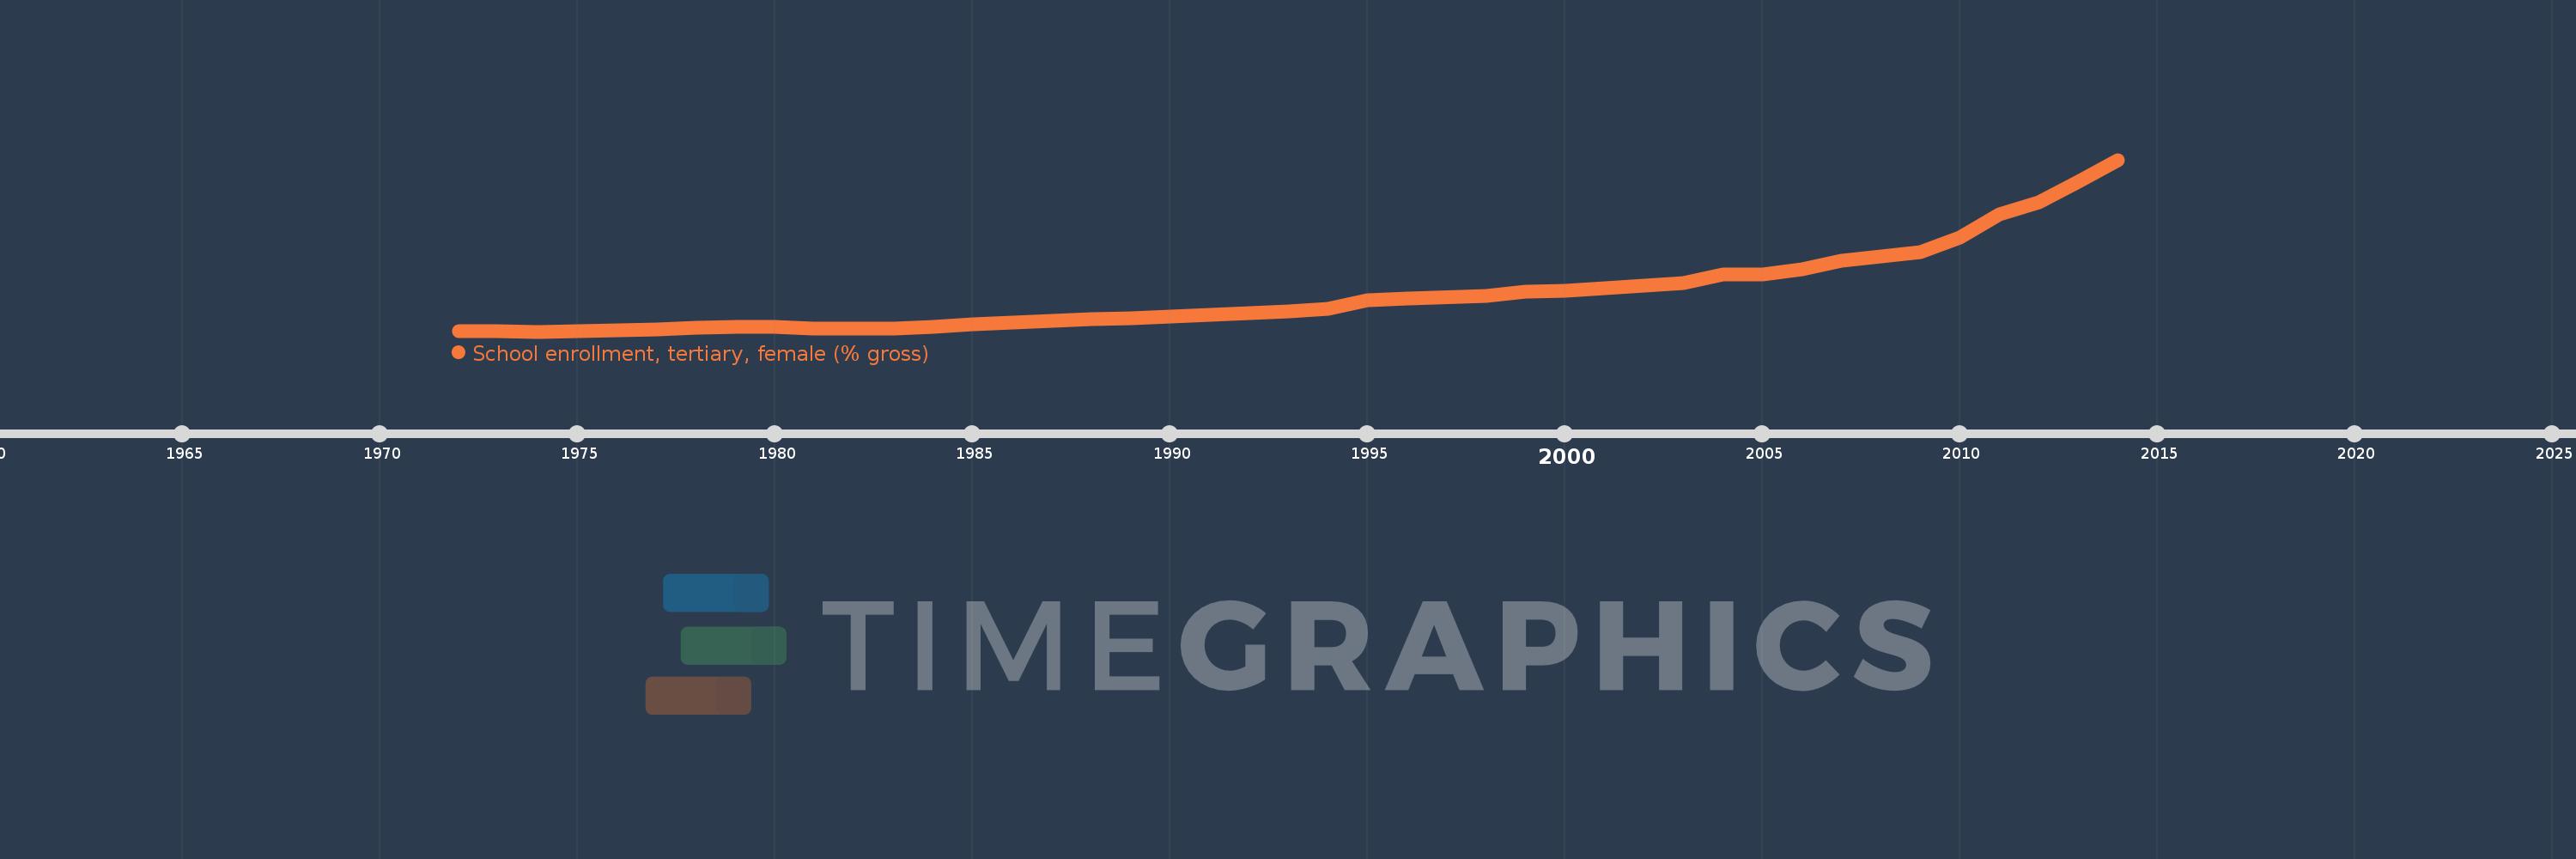
School enrollment, tertiary, female (% gross)
2014,2013,2012,2011,2010,2009,2008,2007,2006,2005,2004,2003,2002,2000,1999,1998,1996,1995,1994,1993,1992,1991,1990,1989,1988,1987,1986,1985,1984,1983,1981,1980,1979,1978,1977,1976,1975,1974,1973,1972
Estas estadísticas en otros países:
AfghanistanAlbaniaAlgeriaAngolaAntigua and BarbudaArab WorldArgentinaArmeniaArubaAustraliaAustriaAzerbaijanBahamas, TheBahrainBangladeshBarbadosBelarusBelgiumBelizeBeninBermudaBhutanBoliviaBosnia and HerzegovinaBotswanaBrazilBrunei DarussalamBulgariaBurkina FasoBurundiCabo VerdeCambodiaCameroonCanadaCaribbean small statesCentral African RepublicCentral Europe and the BalticsChadChileChinaColombiaComorosCongo, Dem. Rep.Congo, Rep.Costa RicaCote d'IvoireCroatiaCubaCuracaoCyprusCzech RepublicDenmarkDjiboutiDominicaDominican RepublicEarly-demographic dividendEast Asia & PacificEast Asia & Pacific (excluding high income)East Asia & Pacific (IDA & IBRD countries)EcuadorEgypt, Arab Rep.El SalvadorEquatorial GuineaEritreaEstoniaEthiopiaEuro areaEurope & Central AsiaEurope & Central Asia (excluding high income)Europe & Central Asia (IDA & IBRD countries)European UnionFijiFinlandFragile and conflict affected situationsFranceGabonGambia, TheGeorgiaGermanyGhanaGreeceGrenadaGuatemalaGuineaGuinea-BissauGuyanaHaitiHeavily indebted poor countries (HIPC)High incomeHondurasHong Kong SAR, ChinaHungaryIBRD onlyIcelandIDA & IBRD totalIDA blendIDA onlyIDA totalIndiaIndonesiaIran, Islamic Rep.IraqIrelandIsraelItalyJamaicaJapanJordanKazakhstanKenyaKorea, Dem. People’s Rep.Korea, Rep.KuwaitKyrgyz RepublicLao PDRLate-demographic dividendLatin America & Caribbean Latin America & Caribbean (excluding high income)Latin America & the Caribbean (IDA & IBRD countries)LatviaLeast developed countries: UN classificationLebanonLesothoLiberiaLibyaLiechtensteinLithuaniaLow & middle incomeLow incomeLower middle incomeLuxembourgMacao SAR, ChinaMacedonia, FYRMadagascarMalawiMaldivesMaliMaltaMarshall IslandsMauritaniaMauritiusMexicoMicronesia, Fed. Sts.Middle East & North AfricaMiddle East & North Africa (excluding high income)Middle East & North Africa (IDA & IBRD countries)Middle incomeMoldovaMongoliaMontenegroMoroccoMozambiqueMyanmarNamibiaNepalNetherlandsNew ZealandNicaraguaNigerNigeriaNorth AmericaNorwayOECD membersOmanOther small statesPacific island small statesPakistanPalauPanamaPapua New GuineaParaguayPeruPhilippinesPolandPortugalPost-demographic dividendPre-demographic dividendPuerto RicoQatarRomaniaRussian FederationRwandaSamoaSan MarinoSao Tome and PrincipeSaudi ArabiaSenegalSerbiaSeychellesSierra LeoneSingaporeSlovak RepublicSloveniaSmall statesSomaliaSouth AfricaSouth AsiaSouth Asia (IDA & IBRD)SpainSri LankaSt. Kitts and NevisSt. LuciaSt. Vincent and the GrenadinesSub-Saharan Africa Sub-Saharan Africa (excluding high income)Sub-Saharan Africa (IDA & IBRD countries)SudanSurinameSwazilandSwedenSwitzerlandSyrian Arab RepublicTajikistanTanzaniaThailandTimor-LesteTogoTongaTrinidad and TobagoTunisiaTurkeyTurkmenistanUgandaUkraineUnited Arab EmiratesUnited KingdomUnited StatesUpper middle incomeUruguayUzbekistanVanuatuVenezuela, RBVietnamWest Bank and GazaWorldYemen, Rep.ZambiaZimbabwe línea de tiempo (timeline):
En esta escala de tiempo se presenta un gráfico de 1972 y 2014 de Turkey. Los datos de 1971 están ausentes. El número de observaciones reales por fecha: 40.
Fuente (nombre):
Indicadores del desarrollo mundial
Fuente (organización):
United Nations Educational, Scientific, and Cultural Organization (UNESCO) Institute for Statistics.
Categorías:
Education, Gender
Se ha actualizado:
23 abr 2017 año
Los indicadores de los cambios de valor en los últimos años
Mínimo:
1.765
1 ene 1974 año
Máximo:
72.905
1 ene 2014 año
A la fecha de observación
Valor
Cambio absoluto
El cambio con respecto al valor anterior
1 ene 1972 año
1.893
+1.893
0.0%
1 ene 1973 año
1.811
-0.082
-4.31%
1 ene 1974 año
1.765
-0.047
-2.57%
1 ene 1975 año
1.919
+0.154
8.73%
1 ene 1976 año
2.328
+0.409
21.33%
1 ene 1977 año
2.606
+0.278
11.96%
1 ene 1978 año
3.237
+0.631
24.2%
1 ene 1979 año
3.634
+0.396
12.25%
1 ene 1980 año
3.69
+0.056
1.55%
1 ene 1981 año
3.079
-0.611
-16.55%
1 ene 1983 año
2.963
-0.117
-3.8%
1 ene 1984 año
3.756
+0.793
26.78%
1 ene 1985 año
4.904
+1.148
30.57%
1 ene 1986 año
5.611
+0.707
14.41%
1 ene 1987 año
6.386
+0.775
13.82%
1 ene 1988 año
6.956
+0.57
8.93%
1 ene 1989 año
7.181
+0.225
3.23%
1 ene 1990 año
7.863
+0.682
9.5%
1 ene 1991 año
8.817
+0.954
12.14%
1 ene 1992 año
9.41
+0.593
6.72%
1 ene 1993 año
10.049
+0.639
6.79%
1 ene 1994 año
11.364
+1.315
13.09%
1 ene 1995 año
14.853
+3.489
30.71%
1 ene 1996 año
15.346
+0.493
3.32%
1 ene 1998 año
16.659
+1.314
8.56%
1 ene 1999 año
18.167
+1.507
9.05%
1 ene 2000 año
18.708
+0.541
2.98%
1 ene 2002 año
20.729
+2.021
10.8%
1 ene 2003 año
21.81
+1.081
5.22%
1 ene 2004 año
25.37
+3.56
16.32%
1 ene 2005 año
25.532
+0.161
0.64%
1 ene 2006 año
27.632
+2.101
8.23%
1 ene 2007 año
31.236
+3.603
13.04%
1 ene 2008 año
33.049
+1.813
5.8%
1 ene 2009 año
34.718
+1.67
5.05%
1 ene 2010 año
40.642
+5.924
17.06%
1 ene 2011 año
50.195
+9.553
23.5%
1 ene 2012 año
55.422
+5.227
10.41%
1 ene 2013 año
63.701
+8.279
14.94%
1 ene 2014 año
72.905
+9.204
14.45%
Ranking de los países por los datos estadísticos actuales


Comentarios: