29
/es/
es
AIzaSyAYiBZKx7MnpbEhh9jyipgxe19OcubqV5w
April 1, 2024
269328
Turkey
TUR
true
2
1
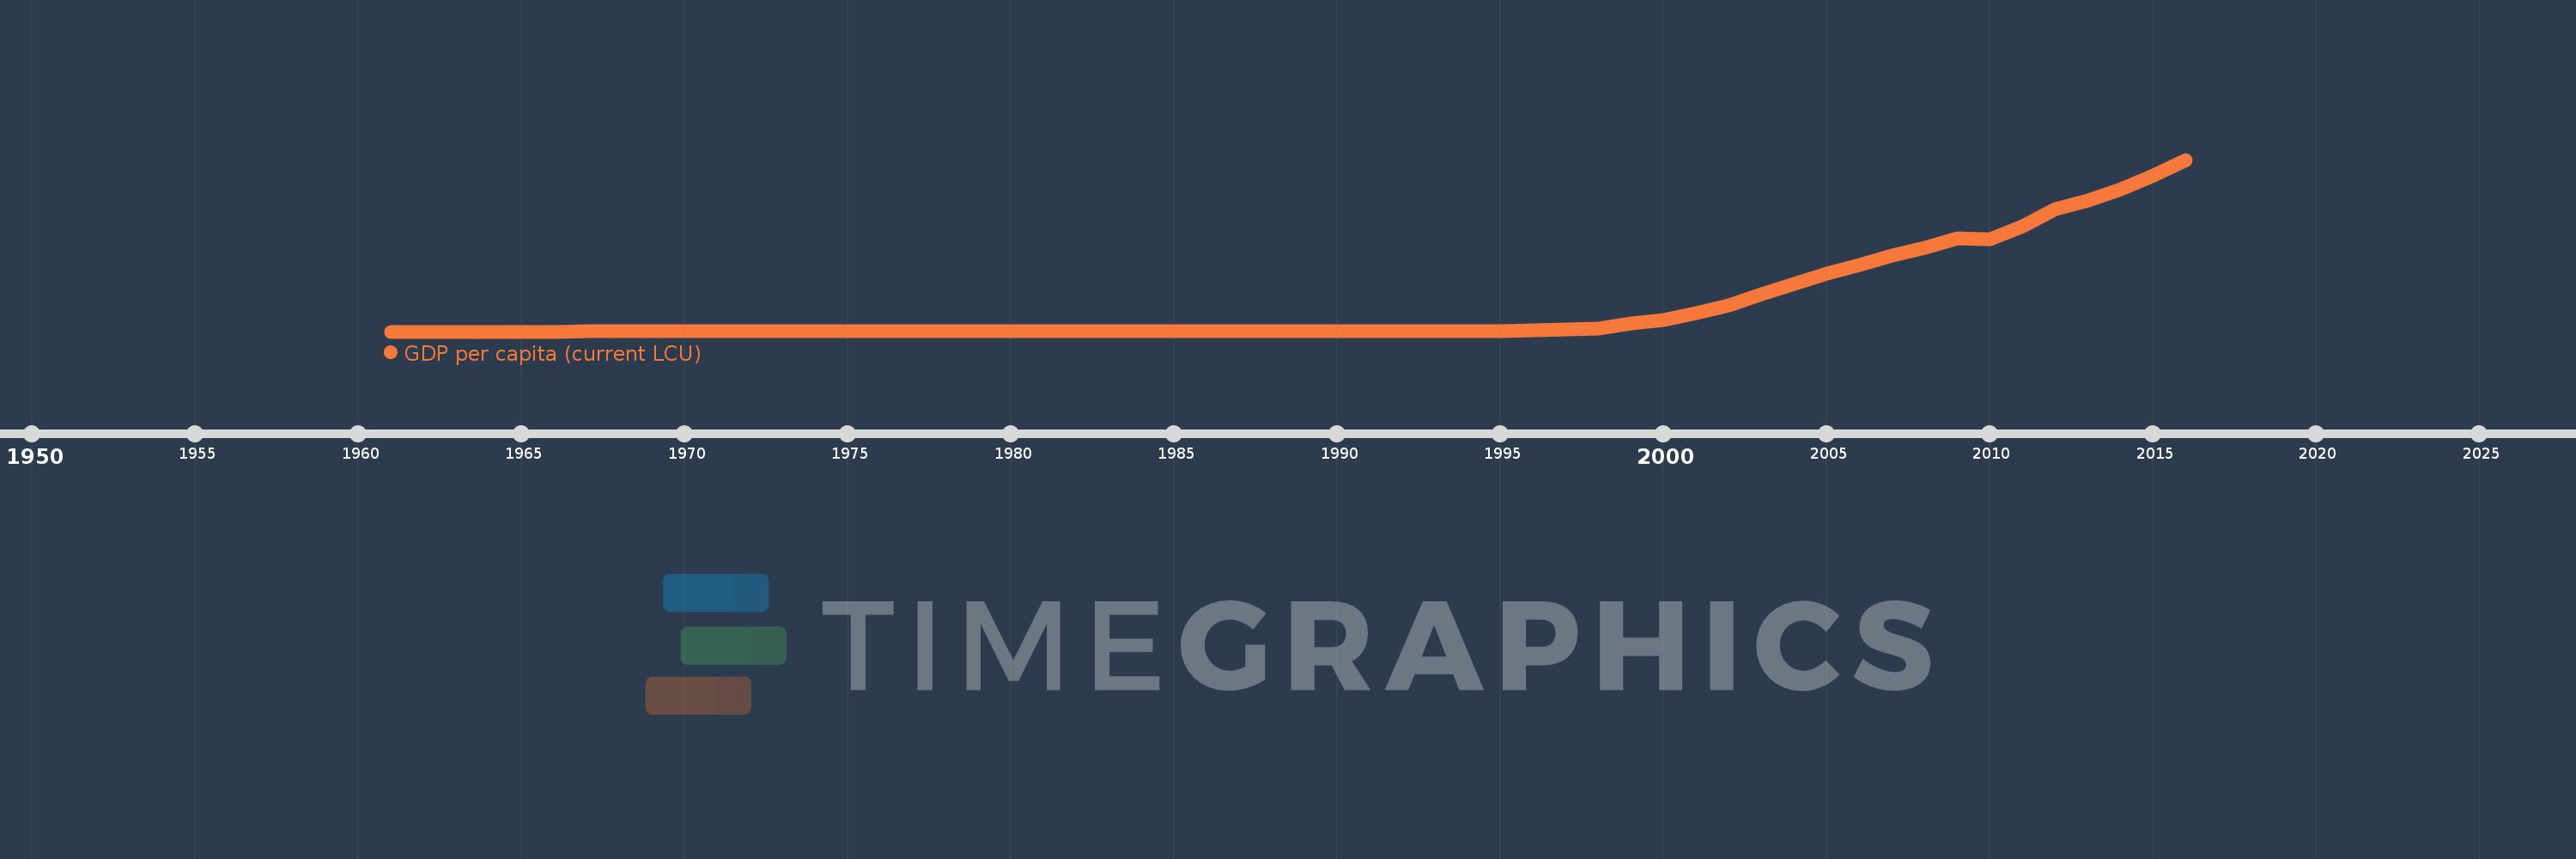
GDP per capita (current LCU)
2016,2015,2014,2013,2012,2011,2010,2009,2008,2007,2006,2005,2004,2003,2002,2001,2000,1999,1998,1997,1996,1995,1994,1993,1992,1991,1990,1989,1988,1987,1986,1985,1984,1983,1982,1981,1980,1979,1978,1977,1976,1975,1974,1973,1972,1971,1970,1969,1968,1967,1966,1965,1964,1963,1962,1961
Estas estadísticas en otros países:
AfghanistanAlbaniaAlgeriaAndorraAngolaAntigua and BarbudaArgentinaArmeniaArubaAustraliaAustriaAzerbaijanBahamas, TheBahrainBangladeshBarbadosBelarusBelgiumBelizeBeninBermudaBhutanBoliviaBosnia and HerzegovinaBotswanaBrazilBrunei DarussalamBulgariaBurkina FasoBurundiCabo VerdeCambodiaCameroonCanadaCayman IslandsCentral African RepublicChadChannel IslandsChileChinaColombiaComorosCongo, Dem. Rep.Congo, Rep.Costa RicaCote d'IvoireCroatiaCubaCyprusCzech RepublicDenmarkDjiboutiDominicaDominican RepublicEcuadorEgypt, Arab Rep.El SalvadorEquatorial GuineaEritreaEstoniaEthiopiaFaroe IslandsFijiFinlandFranceFrench PolynesiaGabonGambia, TheGeorgiaGermanyGhanaGreeceGreenlandGrenadaGuatemalaGuineaGuinea-BissauGuyanaHaitiHondurasHong Kong SAR, ChinaHungaryIcelandIndiaIndonesiaIran, Islamic Rep.IraqIrelandIsle of ManIsraelItalyJamaicaJapanJordanKazakhstanKenyaKiribatiKorea, Rep.KosovoKuwaitKyrgyz RepublicLao PDRLatviaLebanonLesothoLiberiaLibyaLiechtensteinLithuaniaLuxembourgMacao SAR, ChinaMacedonia, FYRMadagascarMalawiMalaysiaMaldivesMaliMaltaMarshall IslandsMauritaniaMauritiusMexicoMicronesia, Fed. Sts.MoldovaMonacoMongoliaMontenegroMoroccoMozambiqueMyanmarNamibiaNauruNepalNetherlandsNew CaledoniaNew ZealandNicaraguaNigerNigeriaNorwayOmanPakistanPalauPanamaPapua New GuineaParaguayPeruPhilippinesPolandPortugalPuerto RicoQatarRomaniaRussian FederationRwandaSamoaSan MarinoSao Tome and PrincipeSaudi ArabiaSenegalSerbiaSeychellesSierra LeoneSingaporeSint Maarten (Dutch part)Slovak RepublicSloveniaSolomon IslandsSomaliaSouth AfricaSouth SudanSpainSri LankaSt. Kitts and NevisSt. LuciaSt. Vincent and the GrenadinesSudanSurinameSwazilandSwedenSwitzerlandSyrian Arab RepublicTajikistanTanzaniaThailandTimor-LesteTogoTongaTrinidad and TobagoTunisiaTurkeyTurkmenistanTuvaluUgandaUkraineUnited Arab EmiratesUnited KingdomUnited StatesUruguayUzbekistanVanuatuVenezuela, RBVietnamVirgin Islands (U.S.)West Bank and GazaYemen, Rep.ZambiaZimbabwe línea de tiempo (timeline):
En esta escala de tiempo se presenta un gráfico de 1961 y 2016 de Turkey. Los datos de 1960 están ausentes. El número de observaciones reales por fecha: 56.
Fuente (nombre):
Indicadores del desarrollo mundial
Fuente (organización):
World Bank national accounts data, and OECD National Accounts data files.
Categorías:
Economy & Growth
Se ha actualizado:
23 abr 2017 año
Los indicadores de los cambios de valor en los últimos años
Mínimo:
0.002
1 ene 1961 año
Máximo:
24.822 mil
1 ene 2016 año
A la fecha de observación
Valor
Cambio absoluto
El cambio con respecto al valor anterior
1 ene 1961 año
0.002
+0.002
0.0%
1 ene 1962 año
0.003
+0.0
3.48%
1 ene 1963 año
0.003
+0.0
8.6%
1 ene 1964 año
0.003
+0.0
13.37%
1 ene 1965 año
0.003
+0.0
5.46%
1 ene 1966 año
0.003
+0.0
4.42%
1 ene 1967 año
0.004
+0.001
15.56%
1 ene 1968 año
0.004
+0.0
8.44%
1 ene 1969 año
0.005
+0.0
9.19%
1 ene 1970 año
0.005
+0.0
8.71%
1 ene 1971 año
0.006
+0.0
9.57%
1 ene 1972 año
0.007
+0.001
20.51%
1 ene 1973 año
0.008
+0.001
16.38%
1 ene 1974 año
0.01
+0.002
22.9%
1 ene 1975 año
0.013
+0.003
32.99%
1 ene 1976 año
0.016
+0.003
26.98%
1 ene 1977 año
0.021
+0.004
24.79%
1 ene 1978 año
0.026
+0.005
25.44%
1 ene 1979 año
0.038
+0.012
46.43%
1 ene 1980 año
0.065
+0.027
71.69%
1 ene 1981 año
0.119
+0.054
84.02%
1 ene 1982 año
0.176
+0.057
47.59%
1 ene 1983 año
0.228
+0.052
29.73%
1 ene 1984 año
0.295
+0.067
29.51%
1 ene 1985 año
0.457
+0.162
54.68%
1 ene 1986 año
0.714
+0.257
56.17%
1 ene 1987 año
1.018
+0.304
42.62%
1 ene 1988 año
1.46
+0.443
43.48%
1 ene 1989 año
2.479
+1.019
69.76%
1 ene 1990 año
4.284
+1.805
72.8%
1 ene 1991 año
7.28
+2.996
69.94%
1 ene 1992 año
11.476
+4.196
57.64%
1 ene 1993 año
19.59
+8.115
70.72%
1 ene 1994 año
34.949
+15.358
78.4%
1 ene 1995 año
67.15
+32.201
92.14%
1 ene 1996 año
132.641
+65.491
97.53%
1 ene 1997 año
248.473
+115.832
87.33%
1 ene 1998 año
477.462
+228.989
92.16%
1 ene 1999 año
1.144 mil
+666.939
139.68%
1 ene 2000 año
1.679 mil
+534.624
46.72%
1 ene 2001 año
2.635 mil
+956.294
56.96%
1 ene 2002 año
3.743 mil
+1.107 mil
42.03%
1 ene 2003 año
5.382 mil
+1.639 mil
43.78%
1 ene 2004 año
6.884 mil
+1.503 mil
27.93%
1 ene 2005 año
8.347 mil
+1.463 mil
21.25%
1 ene 2006 año
9.563 mil
+1.216 mil
14.56%
1 ene 2007 año
11.038 mil
+1.476 mil
15.43%
1 ene 2008 año
12.129 mil
+1.091 mil
9.88%
1 ene 2009 año
13.513 mil
+1.383 mil
11.4%
1 ene 2010 año
13.367 mil
-145.465
-1.08%
1 ene 2011 año
15.196 mil
+1.828 mil
13.68%
1 ene 2012 año
17.652 mil
+2.456 mil
16.16%
1 ene 2013 año
18.929 mil
+1.277 mil
7.23%
1 ene 2014 año
20.562 mil
+1.633 mil
8.63%
1 ene 2015 año
22.55 mil
+1.988 mil
9.67%
1 ene 2016 año
24.822 mil
+2.272 mil
10.07%
Ranking de los países por los datos estadísticos actuales


Comentarios: