29
/es/
es
AIzaSyAYiBZKx7MnpbEhh9jyipgxe19OcubqV5w
April 1, 2024
268763
Tunisia
TUN
true
2
1
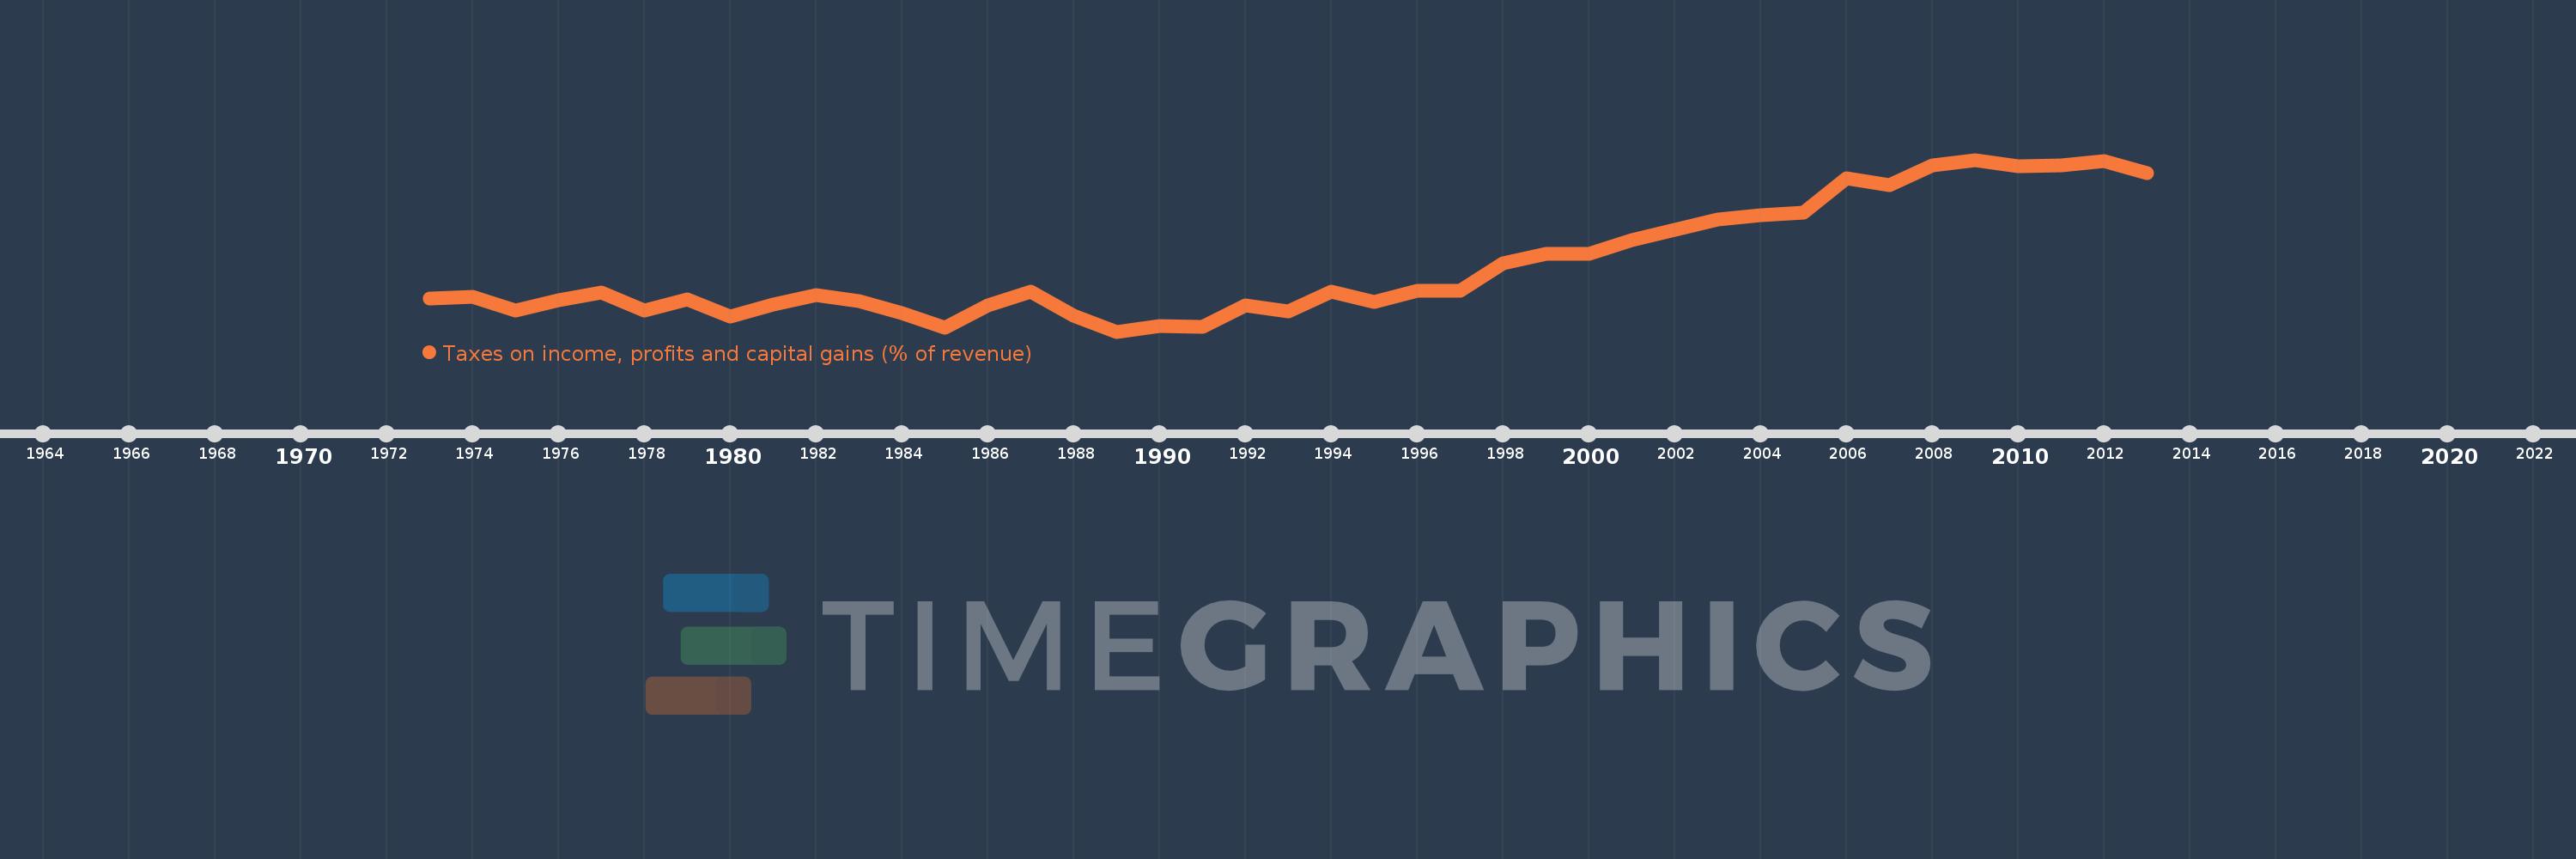
Taxes on income, profits and capital gains (% of revenue)
2013,2012,2011,2010,2009,2008,2007,2006,2005,2004,2003,2002,2001,2000,1999,1998,1997,1996,1995,1994,1993,1992,1991,1990,1989,1988,1987,1986,1985,1984,1983,1982,1981,1980,1979,1978,1977,1976,1975,1974,1973
Estas estadísticas en otros países:
AfghanistanAlbaniaAlgeriaAngolaAntigua and BarbudaArab WorldArgentinaArmeniaAustraliaAustriaAzerbaijanBahrainBangladeshBarbadosBelarusBelgiumBelizeBeninBhutanBoliviaBosnia and HerzegovinaBotswanaBrazilBulgariaBurkina FasoBurundiCabo VerdeCambodiaCanadaCaribbean small statesCentral African RepublicCentral Europe and the BalticsChileChinaColombiaCongo, Dem. Rep.Congo, Rep.Costa RicaCote d'IvoireCroatiaCyprusCzech RepublicDenmarkDominicaDominican RepublicEarly-demographic dividendEast Asia & PacificEast Asia & Pacific (excluding high income)East Asia & Pacific (IDA & IBRD countries)Egypt, Arab Rep.El SalvadorEquatorial GuineaEstoniaEthiopiaEuro areaEurope & Central AsiaEurope & Central Asia (excluding high income)Europe & Central Asia (IDA & IBRD countries)European UnionFijiFinlandFranceGambia, TheGeorgiaGermanyGhanaGreeceGrenadaGuatemalaHeavily indebted poor countries (HIPC)High incomeHondurasHong Kong SAR, ChinaHungaryIBRD onlyIcelandIDA & IBRD totalIDA blendIDA onlyIDA totalIndiaIndonesiaIran, Islamic Rep.IraqIrelandIsraelItalyJamaicaJapanJordanKazakhstanKenyaKiribatiKorea, Rep.KuwaitKyrgyz RepublicLao PDRLate-demographic dividendLatin America & Caribbean Latin America & Caribbean (excluding high income)Latin America & the Caribbean (IDA & IBRD countries)LatviaLeast developed countries: UN classificationLebanonLesothoLiberiaLithuaniaLow & middle incomeLow incomeLower middle incomeLuxembourgMacao SAR, ChinaMacedonia, FYRMadagascarMalawiMalaysiaMaldivesMaliMaltaMauritiusMexicoMicronesia, Fed. Sts.Middle East & North AfricaMiddle East & North Africa (excluding high income)Middle East & North Africa (IDA & IBRD countries)Middle incomeMoldovaMongoliaMoroccoMozambiqueMyanmarNamibiaNepalNetherlandsNew ZealandNicaraguaNigeriaNorth AmericaNorwayOECD membersOmanOther small statesPakistanPanamaPapua New GuineaParaguayPeruPhilippinesPolandPortugalPost-demographic dividendPre-demographic dividendQatarRomaniaRussian FederationRwandaSamoaSan MarinoSao Tome and PrincipeSenegalSerbiaSeychellesSierra LeoneSingaporeSlovak RepublicSloveniaSmall statesSolomon IslandsSouth AfricaSouth AsiaSouth Asia (IDA & IBRD)SpainSri LankaSt. Kitts and NevisSt. LuciaSub-Saharan Africa Sub-Saharan Africa (excluding high income)Sub-Saharan Africa (IDA & IBRD countries)SurinameSwazilandSwedenSwitzerlandSyrian Arab RepublicTajikistanTanzaniaThailandTimor-LesteTogoTrinidad and TobagoTunisiaTurkeyUgandaUkraineUnited KingdomUnited StatesUpper middle incomeUruguayVenezuela, RBVietnamWest Bank and GazaWorldYemen, Rep.ZambiaZimbabwe línea de tiempo (timeline):
En esta escala de tiempo se presenta un gráfico de 1973 y 2013 de Tunisia. Los datos de 1972 están ausentes. El número de observaciones reales por fecha: 41.
Fuente (nombre):
Indicadores del desarrollo mundial
Fuente (organización):
International Monetary Fund, Government Finance Statistics Yearbook and data files.
Categorías:
Public Sector
Se ha actualizado:
23 abr 2017 año
Los indicadores de los cambios de valor en los últimos años
Mínimo:
11.817
1 ene 1989 año
Máximo:
27.95
1 ene 2009 año
A la fecha de observación
Valor
Cambio absoluto
El cambio con respecto al valor anterior
1 ene 1973 año
14.933
+14.933
0.0%
1 ene 1974 año
15.054
+0.121
0.81%
1 ene 1975 año
13.826
-1.228
-8.16%
1 ene 1976 año
14.727
+0.901
6.52%
1 ene 1977 año
15.471
+0.744
5.05%
1 ene 1978 año
13.796
-1.675
-10.82%
1 ene 1979 año
14.821
+1.025
7.43%
1 ene 1980 año
13.201
-1.62
-10.93%
1 ene 1981 año
14.348
+1.146
8.68%
1 ene 1982 año
15.225
+0.878
6.12%
1 ene 1983 año
14.661
-0.565
-3.71%
1 ene 1984 año
13.537
-1.124
-7.66%
1 ene 1985 año
12.161
-1.376
-10.16%
1 ene 1986 año
14.264
+2.103
17.29%
1 ene 1987 año
15.589
+1.324
9.29%
1 ene 1988 año
13.285
-2.303
-14.78%
1 ene 1989 año
11.817
-1.469
-11.06%
1 ene 1990 año
12.311
+0.495
4.18%
1 ene 1991 año
12.275
-0.036
-0.29%
1 ene 1992 año
14.307
+2.032
16.55%
1 ene 1993 año
13.727
-0.58
-4.06%
1 ene 1994 año
15.538
+1.812
13.2%
1 ene 1995 año
14.622
-0.916
-5.89%
1 ene 1996 año
15.637
+1.015
6.94%
1 ene 1997 año
15.622
-0.015
-0.1%
1 ene 1998 año
18.202
+2.58
16.51%
1 ene 1999 año
19.086
+0.884
4.86%
1 ene 2000 año
19.089
+0.003
0.02%
1 ene 2001 año
20.401
+1.312
6.87%
1 ene 2002 año
21.395
+0.994
4.87%
1 ene 2003 año
22.341
+0.946
4.42%
1 ene 2004 año
22.787
+0.446
2.0%
1 ene 2005 año
23.006
+0.218
0.96%
1 ene 2006 año
26.19
+3.184
13.84%
1 ene 2007 año
25.606
-0.584
-2.23%
1 ene 2008 año
27.413
+1.808
7.06%
1 ene 2009 año
27.95
+0.536
1.96%
1 ene 2010 año
27.335
-0.615
-2.2%
1 ene 2011 año
27.418
+0.083
0.3%
1 ene 2012 año
27.843
+0.425
1.55%
1 ene 2013 año
26.692
-1.15
-4.13%
Ranking de los países por los datos estadísticos actuales


Comentarios: