30
/es/
AIzaSyAYiBZKx7MnpbEhh9jyipgxe19OcubqV5w
April 1, 2024
268752
Tunisia
TUN
true
2
1
Tariff rate, most favored nation, weighted mean, all products (%)
2016,2014,2013,2012,2011,2010,2009,2007,2006,2005,2004,2003,2001,1999,1996,1993,1991
Download
Estadísticas Globales de la Biblioteca →Tunisia →

Tariff rate, most favored nation, weighted mean, all products (%)

Estas estadísticas en otros países:

AfghanistanAlbaniaAlgeriaAngolaAntigua and BarbudaArgentinaArmeniaArubaAustraliaAustriaAzerbaijanBahamas, TheBahrainBangladeshBarbadosBelarusBelgiumBelizeBeninBermudaBhutanBoliviaBosnia and HerzegovinaBotswanaBrazilBrunei DarussalamBulgariaBurkina FasoBurundiCabo VerdeCambodiaCameroonCanadaCentral African RepublicChadChileChinaColombiaComorosCongo, Dem. Rep.Congo, Rep.Costa RicaCote d'IvoireCroatiaCubaCyprusCzech RepublicDenmarkDjiboutiDominicaDominican RepublicEast Asia & Pacific (excluding high income)EcuadorEgypt, Arab Rep.El SalvadorEquatorial GuineaEritreaEstoniaEthiopiaEurope & Central Asia (excluding high income)European UnionFijiFinlandFranceFrench PolynesiaGabonGambia, TheGeorgiaGermanyGhanaGreeceGrenadaGuatemalaGuineaGuinea-BissauGuyanaHaitiHigh incomeHondurasHong Kong SAR, ChinaHungaryIcelandIndiaIndonesiaIran, Islamic Rep.IrelandIsraelItalyJamaicaJapanJordanKazakhstanKenyaKorea, Rep.KuwaitKyrgyz RepublicLao PDRLatin America & Caribbean (excluding high income)LatviaLebanonLesothoLiberiaLibyaLithuaniaLow & middle incomeLow incomeLower middle incomeLuxembourgMacao SAR, ChinaMacedonia, FYRMadagascarMalawiMalaysiaMaldivesMaliMaltaMauritaniaMauritiusMexicoMiddle East & North Africa (excluding high income)Middle incomeMoldovaMongoliaMontenegroMoroccoMozambiqueMyanmarNamibiaNepalNetherlandsNew ZealandNicaraguaNigerNigeriaNorwayOECD membersOmanPakistanPalauPanamaPapua New GuineaParaguayPeruPhilippinesPolandPortugalQatarRomaniaRussian FederationRwandaSamoaSaudi ArabiaSenegalSerbiaSeychellesSierra LeoneSingaporeSlovak RepublicSloveniaSolomon IslandsSouth AfricaSouth AsiaSpainSri LankaSt. Kitts and NevisSt. LuciaSt. Vincent and the GrenadinesSub-Saharan Africa (excluding high income)SudanSurinameSwazilandSwedenSwitzerlandSyrian Arab RepublicTajikistanTanzaniaThailandTimor-LesteTogoTongaTrinidad and TobagoTunisiaTurkeyTurkmenistanTuvaluUgandaUkraineUnited Arab EmiratesUnited KingdomUnited StatesUpper middle incomeUruguayUzbekistanVanuatuVenezuela, RBVietnamWorldYemen, Rep.ZambiaZimbabwe

línea de tiempo (timeline):

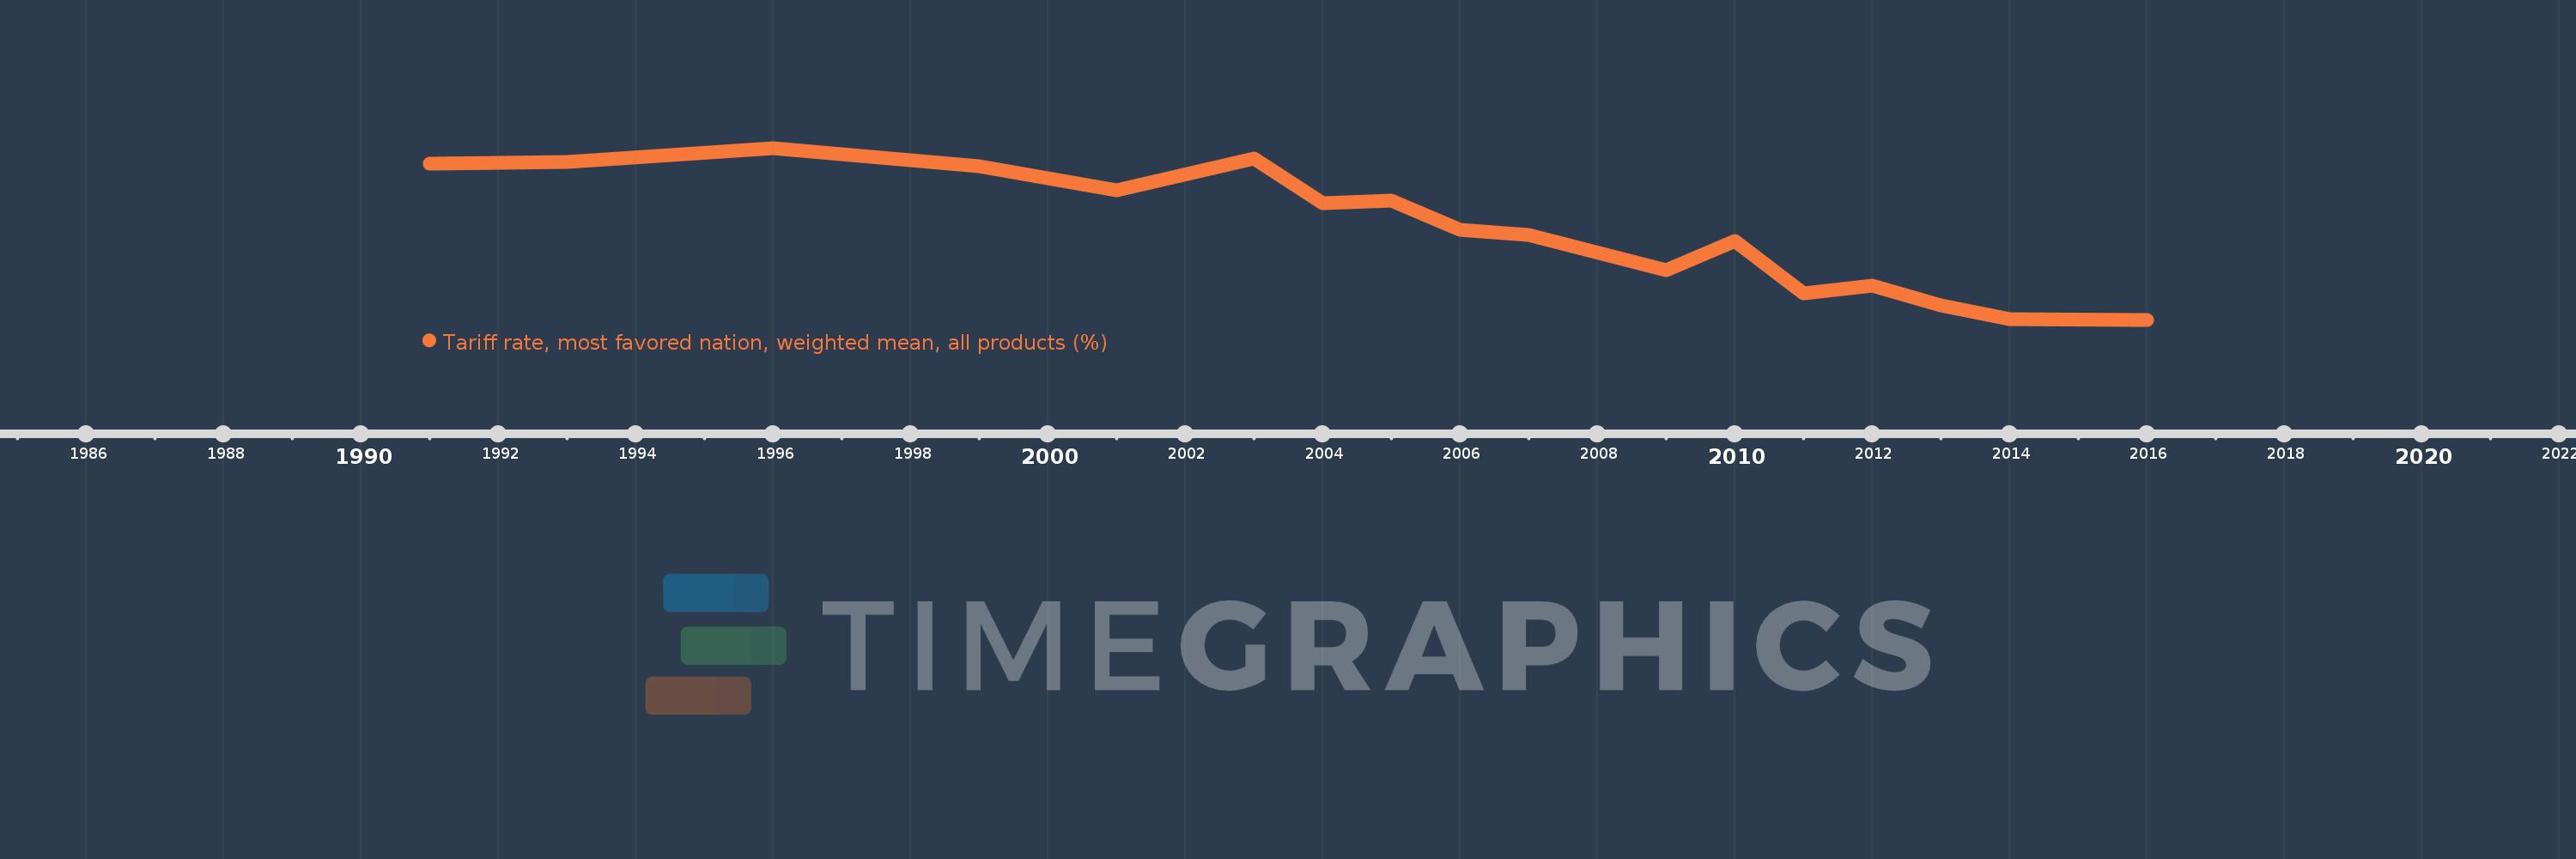
En esta escala de tiempo se presenta un gráfico de 1991 y 2016 de Tunisia. Los datos de 1990 están ausentes. El número de observaciones reales por fecha: 17.

Fuente (nombre):

Indicadores del desarrollo mundial

Fuente (organización):

World Bank staff estimates using the World Integrated Trade Solution system, based on data from United Nations Conference on Trade and Development's Trade Analysis and Information System (TRAINS) database and the World Trade Organization’s (WTO) Integrated Data Base (IDB) and Consolidated Tariff Schedules (CTS) database.

Categorías:

Private Sector, Trade

Se ha actualizado:

23 abr 2017 año

Los indicadores de los cambios de valor en los últimos años

En promedio:
19.762
Mínimo:
11.26
1 ene 2016 año
Máximo:
27.36
1 ene 1996 año
A la fecha de observación
Valor
Cambio absoluto
El cambio con respecto al valor anterior
1 ene 1991 año
25.87
+25.87
0.0%
1 ene 1993 año
26.02
+0.15
0.58%
1 ene 1996 año
27.36
+1.34
5.15%
1 ene 1999 año
25.67
-1.69
-6.18%
1 ene 2001 año
23.38
-2.29
-8.92%
1 ene 2003 año
26.39
+3.01
12.87%
1 ene 2004 año
22.15
-4.24
-16.07%
1 ene 2005 año
22.4
+0.25
1.13%
1 ene 2006 año
19.65
-2.75
-12.28%
1 ene 2007 año
19.17
-0.48
-2.44%
1 ene 2009 año
15.93
-3.24
-16.9%
1 ene 2010 año
18.61
+2.68
16.82%
1 ene 2011 año
13.77
-4.84
-26.01%
1 ene 2012 año
14.46
+0.69
5.01%
1 ene 2013 año
12.58
-1.88
-13.0%
1 ene 2014 año
11.28
-1.3
-10.33%
1 ene 2016 año
11.26
-0.02
-0.18%

Ranking de los países por los datos estadísticos actuales