29
/es/
es
AIzaSyAYiBZKx7MnpbEhh9jyipgxe19OcubqV5w
April 1, 2024
268052
Tunisia
TUN
true
2
1
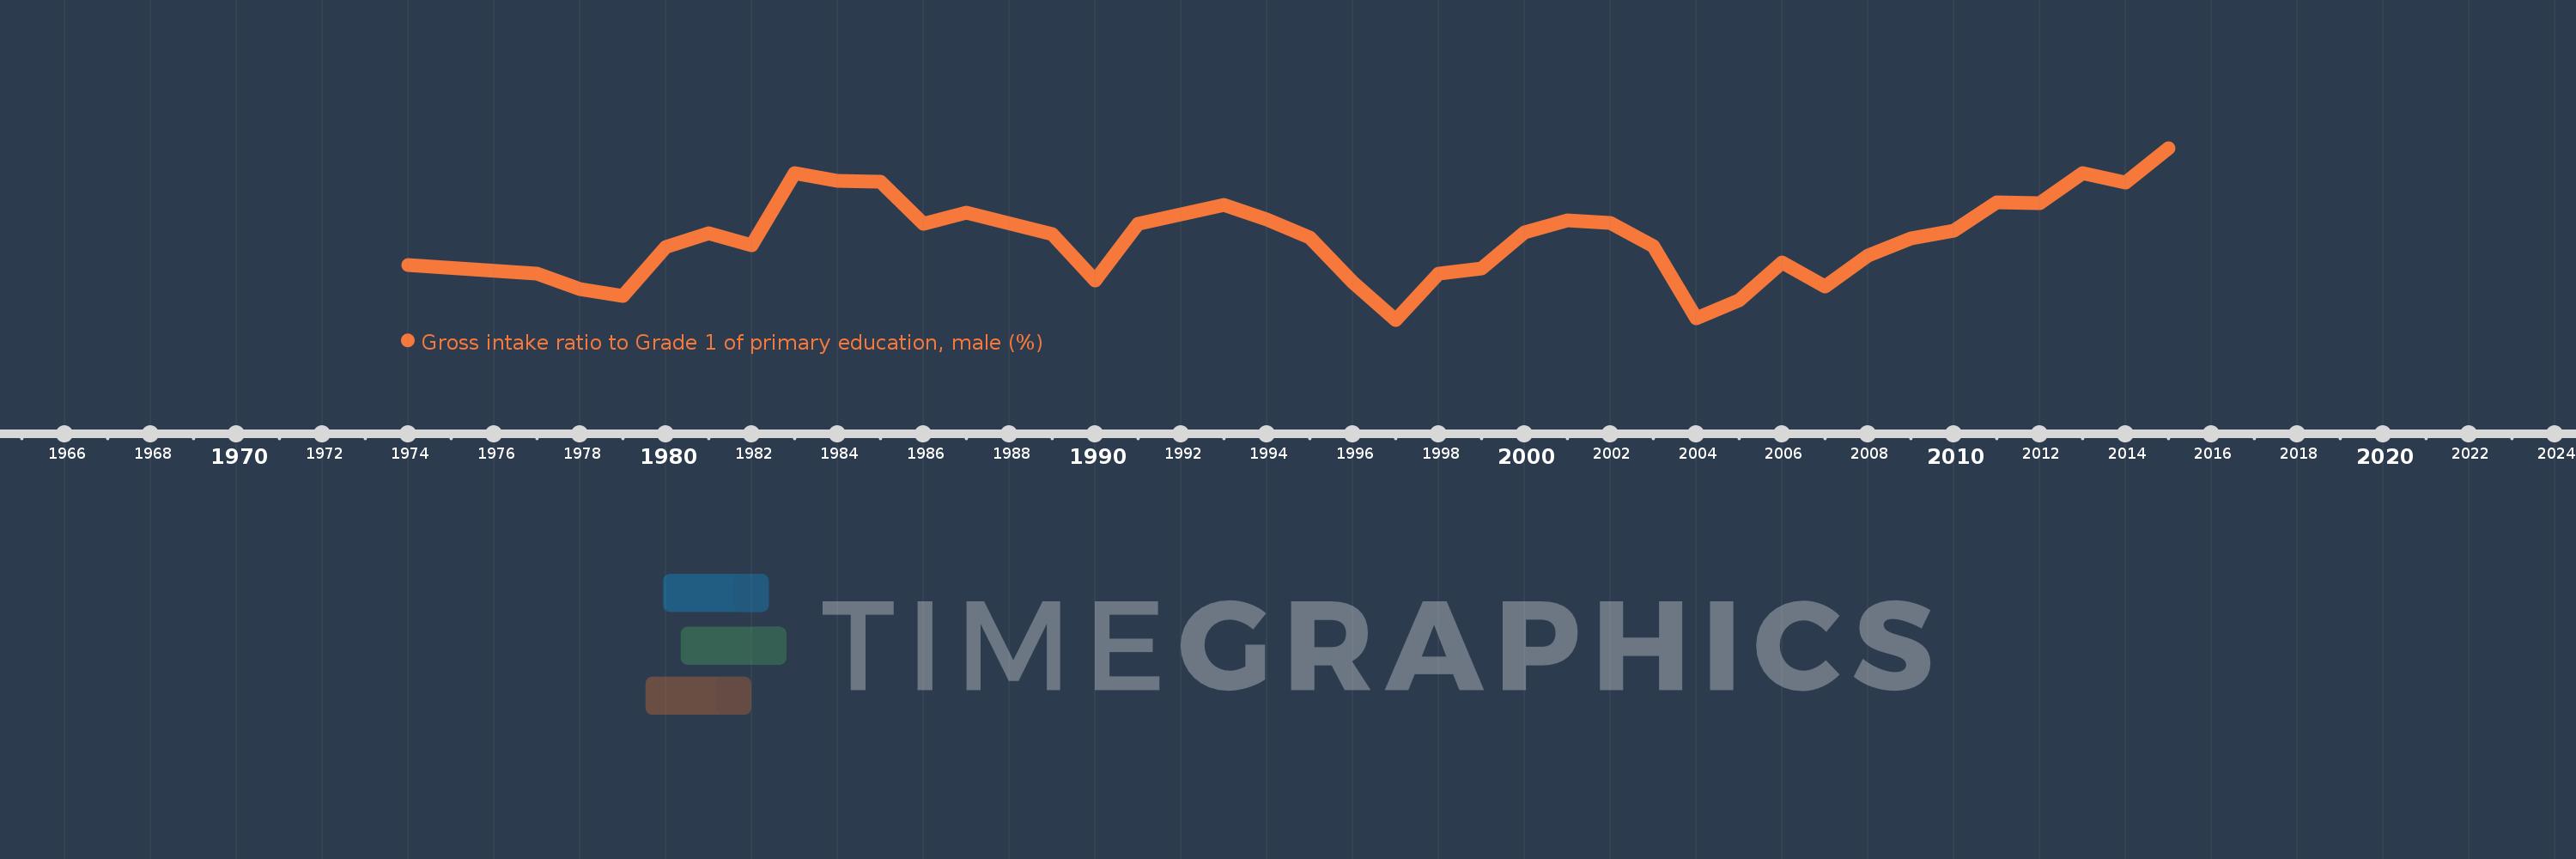
Gross intake ratio to Grade 1 of primary education, male (%)
2015,2014,2013,2012,2011,2010,2009,2008,2007,2006,2005,2004,2003,2002,2001,2000,1999,1998,1997,1996,1995,1994,1993,1992,1991,1990,1989,1987,1986,1985,1984,1983,1982,1981,1980,1979,1978,1977,1974
Estas estadísticas en otros países:
AfghanistanAlbaniaAlgeriaAngolaAntigua and BarbudaArab WorldArgentinaArmeniaArubaAustriaAzerbaijanBahamas, TheBahrainBangladeshBarbadosBelarusBelgiumBelizeBeninBermudaBhutanBoliviaBosnia and HerzegovinaBotswanaBrazilBrunei DarussalamBulgariaBurkina FasoBurundiCabo VerdeCambodiaCameroonCanadaCaribbean small statesCentral African RepublicCentral Europe and the BalticsChadChileChinaColombiaComorosCongo, Dem. Rep.Congo, Rep.Costa RicaCote d'IvoireCroatiaCubaCyprusCzech RepublicDenmarkDjiboutiDominicaDominican RepublicEarly-demographic dividendEast Asia & PacificEast Asia & Pacific (excluding high income)East Asia & Pacific (IDA & IBRD countries)EcuadorEgypt, Arab Rep.El SalvadorEquatorial GuineaEritreaEstoniaEthiopiaEuro areaEurope & Central AsiaEurope & Central Asia (excluding high income)Europe & Central Asia (IDA & IBRD countries)European UnionFijiFinlandFragile and conflict affected situationsFranceGabonGambia, TheGeorgiaGermanyGhanaGreeceGrenadaGuatemalaGuineaGuinea-BissauGuyanaHaitiHeavily indebted poor countries (HIPC)High incomeHondurasHong Kong SAR, ChinaHungaryIBRD onlyIcelandIDA & IBRD totalIDA blendIDA onlyIDA totalIndiaIndonesiaIran, Islamic Rep.IraqIrelandIsraelItalyJamaicaJapanJordanKazakhstanKenyaKiribatiKorea, Dem. People’s Rep.Korea, Rep.KuwaitKyrgyz RepublicLao PDRLate-demographic dividendLatin America & Caribbean Latin America & Caribbean (excluding high income)Latin America & the Caribbean (IDA & IBRD countries)LatviaLeast developed countries: UN classificationLebanonLesothoLiberiaLibyaLiechtensteinLithuaniaLow & middle incomeLow incomeLower middle incomeLuxembourgMacao SAR, ChinaMacedonia, FYRMadagascarMalawiMaldivesMaliMaltaMarshall IslandsMauritaniaMauritiusMexicoMicronesia, Fed. Sts.Middle East & North AfricaMiddle East & North Africa (excluding high income)Middle East & North Africa (IDA & IBRD countries)Middle incomeMoldovaMongoliaMontenegroMoroccoMozambiqueMyanmarNamibiaNauruNepalNetherlandsNew ZealandNicaraguaNigerNigeriaNorth AmericaNorwayOECD membersOmanOther small statesPacific island small statesPakistanPalauPanamaPapua New GuineaParaguayPeruPhilippinesPolandPortugalPost-demographic dividendPre-demographic dividendPuerto RicoQatarRomaniaRussian FederationRwandaSamoaSan MarinoSao Tome and PrincipeSaudi ArabiaSenegalSerbiaSeychellesSierra LeoneSlovak RepublicSloveniaSmall statesSolomon IslandsSouth AfricaSouth AsiaSouth Asia (IDA & IBRD)South SudanSpainSri LankaSt. Kitts and NevisSt. LuciaSt. Vincent and the GrenadinesSub-Saharan Africa Sub-Saharan Africa (excluding high income)Sub-Saharan Africa (IDA & IBRD countries)SudanSurinameSwazilandSwedenSwitzerlandSyrian Arab RepublicTajikistanTanzaniaThailandTimor-LesteTogoTongaTrinidad and TobagoTunisiaTurkeyTuvaluUgandaUkraineUnited Arab EmiratesUnited StatesUpper middle incomeUruguayUzbekistanVanuatuVenezuela, RBVietnamWest Bank and GazaWorldYemen, Rep.ZambiaZimbabwe línea de tiempo (timeline):
En esta escala de tiempo se presenta un gráfico de 1974 y 2015 de Tunisia. Los datos de 1973 están ausentes. El número de observaciones reales por fecha: 39.
Fuente (nombre):
Indicadores del desarrollo mundial
Fuente (organización):
UNESCO Institute for Statistics
Categorías:
Education, Gender
Se ha actualizado:
23 abr 2017 año
Los indicadores de los cambios de valor en los últimos años
Mínimo:
93.442
1 ene 1997 año
Máximo:
113.145
1 ene 2015 año
A la fecha de observación
Valor
Cambio absoluto
El cambio con respecto al valor anterior
1 ene 1974 año
99.751
+99.751
0.0%
1 ene 1977 año
98.72
-1.031
-1.03%
1 ene 1978 año
96.936
-1.783
-1.81%
1 ene 1979 año
96.137
-0.799
-0.82%
1 ene 1980 año
101.803
+5.666
5.89%
1 ene 1981 año
103.391
+1.588
1.56%
1 ene 1982 año
101.974
-1.417
-1.37%
1 ene 1983 año
110.3
+8.326
8.16%
1 ene 1984 año
109.395
-0.905
-0.82%
1 ene 1985 año
109.272
-0.123
-0.11%
1 ene 1986 año
104.428
-4.844
-4.43%
1 ene 1987 año
105.699
+1.271
1.22%
1 ene 1989 año
103.277
-2.423
-2.29%
1 ene 1990 año
97.93
-5.347
-5.18%
1 ene 1991 año
104.443
+6.513
6.65%
1 ene 1992 año
105.575
+1.132
1.08%
1 ene 1993 año
106.622
+1.047
0.99%
1 ene 1994 año
104.963
-1.659
-1.56%
1 ene 1995 año
102.88
-2.083
-1.98%
1 ene 1996 año
97.791
-5.089
-4.95%
1 ene 1997 año
93.442
-4.348
-4.45%
1 ene 1998 año
98.764
+5.321
5.69%
1 ene 1999 año
99.324
+0.561
0.57%
1 ene 2000 año
103.437
+4.113
4.14%
1 ene 2001 año
104.864
+1.426
1.38%
1 ene 2002 año
104.538
-0.326
-0.31%
1 ene 2003 año
101.861
-2.677
-2.56%
1 ene 2004 año
93.646
-8.215
-8.06%
1 ene 2005 año
95.637
+1.991
2.13%
1 ene 2006 año
99.996
+4.36
4.56%
1 ene 2007 año
97.279
-2.717
-2.72%
1 ene 2008 año
100.828
+3.549
3.65%
1 ene 2009 año
102.728
+1.9
1.88%
1 ene 2010 año
103.688
+0.96
0.93%
1 ene 2011 año
106.933
+3.246
3.13%
1 ene 2012 año
106.803
-0.131
-0.12%
1 ene 2013 año
110.253
+3.45
3.23%
1 ene 2014 año
109.177
-1.076
-0.98%
1 ene 2015 año
113.145
+3.968
3.63%
Ranking de los países por los datos estadísticos actuales


Comentarios: