29
/es/
es
AIzaSyAYiBZKx7MnpbEhh9jyipgxe19OcubqV5w
April 1, 2024
267656
Tunisia
TUN
true
2
1
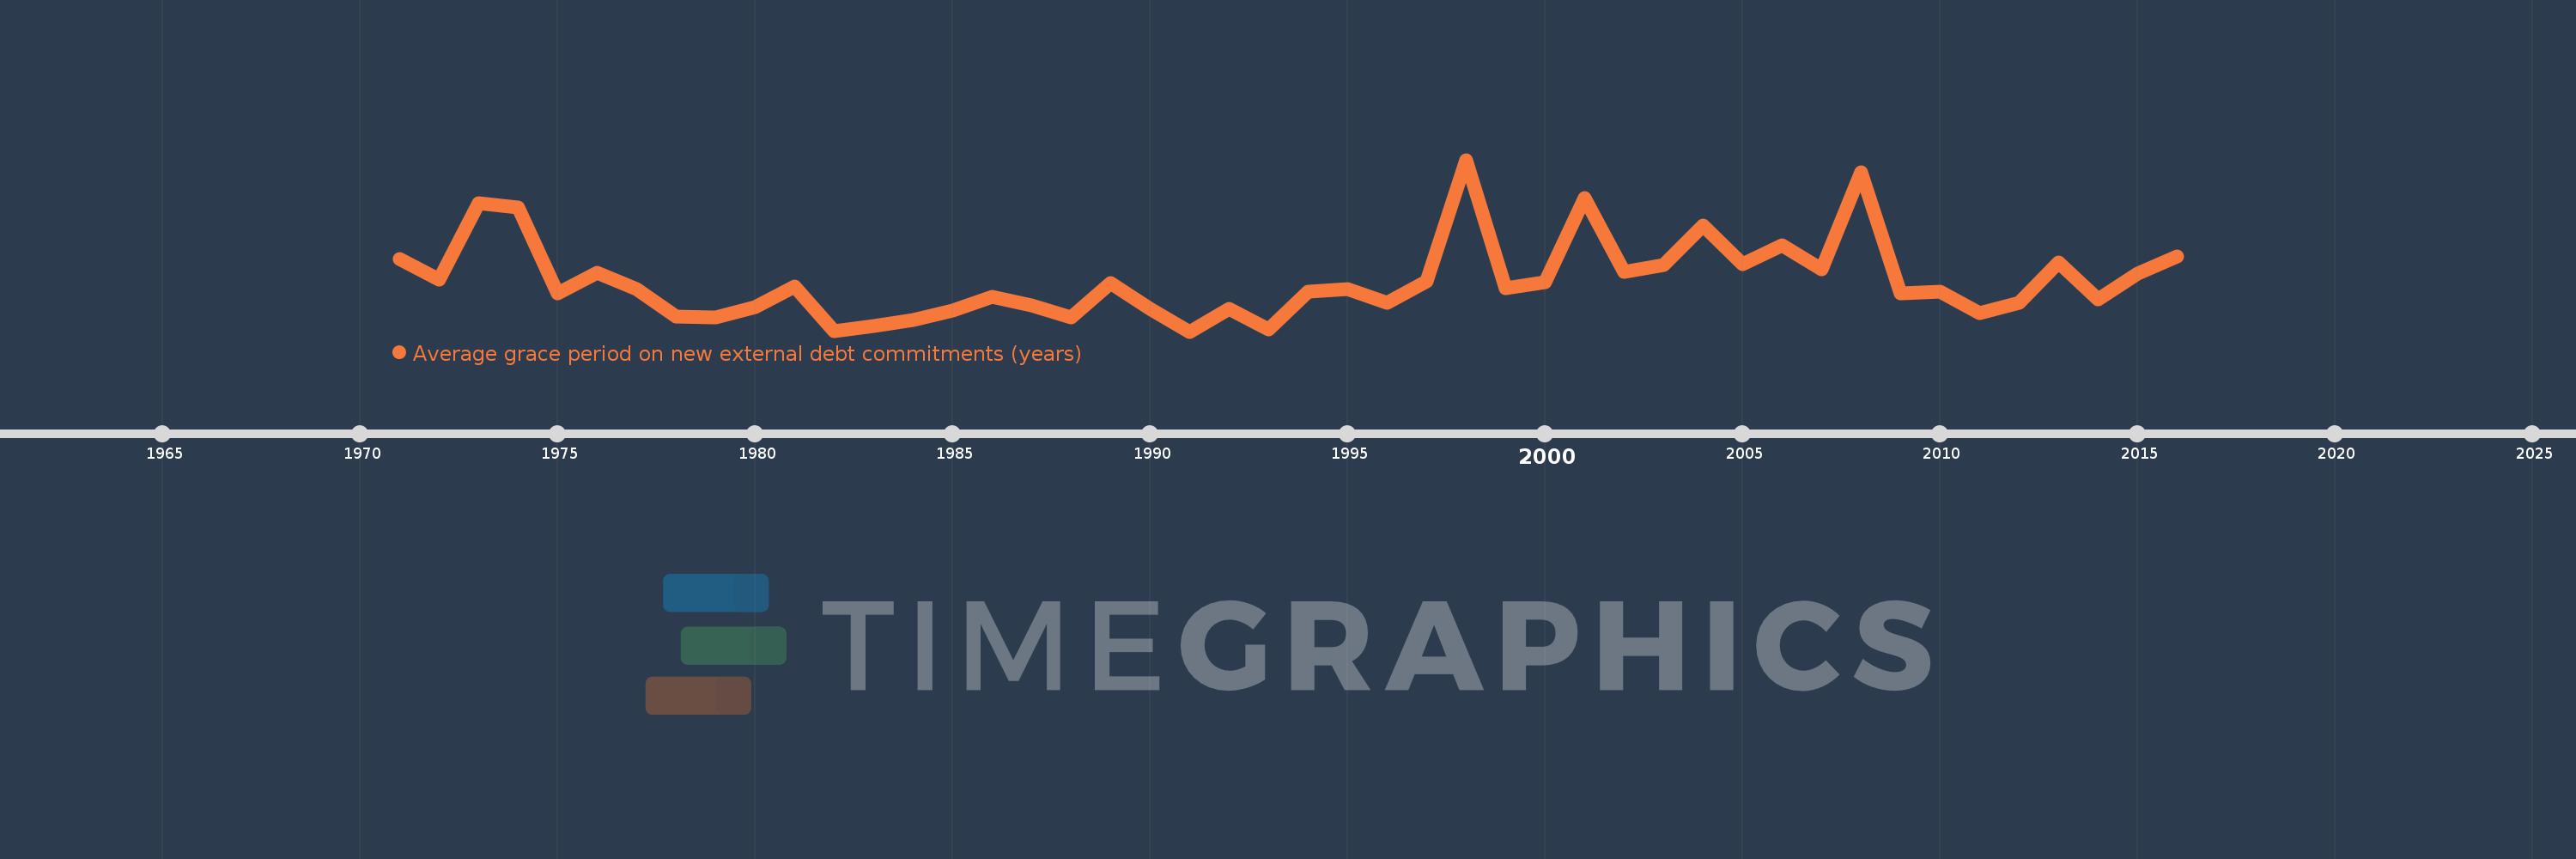
Average grace period on new external debt commitments (years)
2016,2015,2014,2013,2012,2011,2010,2009,2008,2007,2006,2005,2004,2003,2002,2001,2000,1999,1998,1997,1996,1995,1994,1993,1992,1991,1990,1989,1988,1987,1986,1985,1984,1983,1982,1981,1980,1979,1978,1977,1976,1975,1974,1973,1972,1971
Estas estadísticas en otros países:
línea de tiempo (timeline):
En esta escala de tiempo se presenta un gráfico de 1971 y 2016 de Tunisia. Los datos de 1970 están ausentes. El número de observaciones reales por fecha: 46.
Fuente (nombre):
Indicadores del desarrollo mundial
Fuente (organización):
World Bank, International Debt Statistics.
Categorías:
External Debt
Se ha actualizado:
23 abr 2017 año
Los indicadores de los cambios de valor en los últimos años
Mínimo:
3.803
1 ene 1991 año
Máximo:
9.907
1 ene 1998 año
A la fecha de observación
Valor
Cambio absoluto
El cambio con respecto al valor anterior
1 ene 1971 año
6.393
+6.393
0.0%
1 ene 1972 año
5.637
-0.756
-11.82%
1 ene 1973 año
8.369
+2.732
48.47%
1 ene 1974 año
8.206
-0.163
-1.95%
1 ene 1975 año
5.17
-3.037
-37.0%
1 ene 1976 año
5.902
+0.732
14.17%
1 ene 1977 año
5.321
-0.581
-9.84%
1 ene 1978 año
4.35
-0.971
-18.25%
1 ene 1979 año
4.316
-0.034
-0.77%
1 ene 1980 año
4.665
+0.349
8.08%
1 ene 1981 año
5.419
+0.754
16.16%
1 ene 1982 año
3.828
-1.591
-29.36%
1 ene 1983 año
3.999
+0.172
4.49%
1 ene 1984 año
4.214
+0.215
5.36%
1 ene 1985 año
4.545
+0.331
7.86%
1 ene 1986 año
5.032
+0.487
10.72%
1 ene 1987 año
4.729
-0.303
-6.02%
1 ene 1988 año
4.303
-0.426
-9.01%
1 ene 1989 año
5.516
+1.212
28.17%
1 ene 1990 año
4.62
-0.896
-16.24%
1 ene 1991 año
3.803
-0.817
-17.68%
1 ene 1992 año
4.61
+0.807
21.23%
1 ene 1993 año
3.877
-0.733
-15.9%
1 ene 1994 año
5.229
+1.351
34.85%
1 ene 1995 año
5.322
+0.093
1.78%
1 ene 1996 año
4.815
-0.507
-9.52%
1 ene 1997 año
5.579
+0.764
15.86%
1 ene 1998 año
9.907
+4.329
77.59%
1 ene 1999 año
5.356
-4.551
-45.94%
1 ene 2000 año
5.551
+0.195
3.64%
1 ene 2001 año
8.544
+2.993
53.91%
1 ene 2002 año
5.923
-2.621
-30.67%
1 ene 2003 año
6.162
+0.239
4.03%
1 ene 2004 año
7.571
+1.409
22.86%
1 ene 2005 año
6.195
-1.376
-18.17%
1 ene 2006 año
6.885
+0.69
11.14%
1 ene 2007 año
6.009
-0.876
-12.73%
1 ene 2008 año
9.461
+3.452
57.45%
1 ene 2009 año
5.159
-4.302
-45.47%
1 ene 2010 año
5.236
+0.077
1.5%
1 ene 2011 año
4.458
-0.778
-14.86%
1 ene 2012 año
4.814
+0.356
7.99%
1 ene 2013 año
6.262
+1.448
30.08%
1 ene 2014 año
4.946
-1.316
-21.02%
1 ene 2015 año
5.878
+0.932
18.84%
1 ene 2016 año
6.485
+0.607
10.33%
Ranking de los países por los datos estadísticos actuales


Comentarios: