29
/es/
es
AIzaSyAYiBZKx7MnpbEhh9jyipgxe19OcubqV5w
April 1, 2024
266735
Trinidad and Tobago
TTO
true
2
1
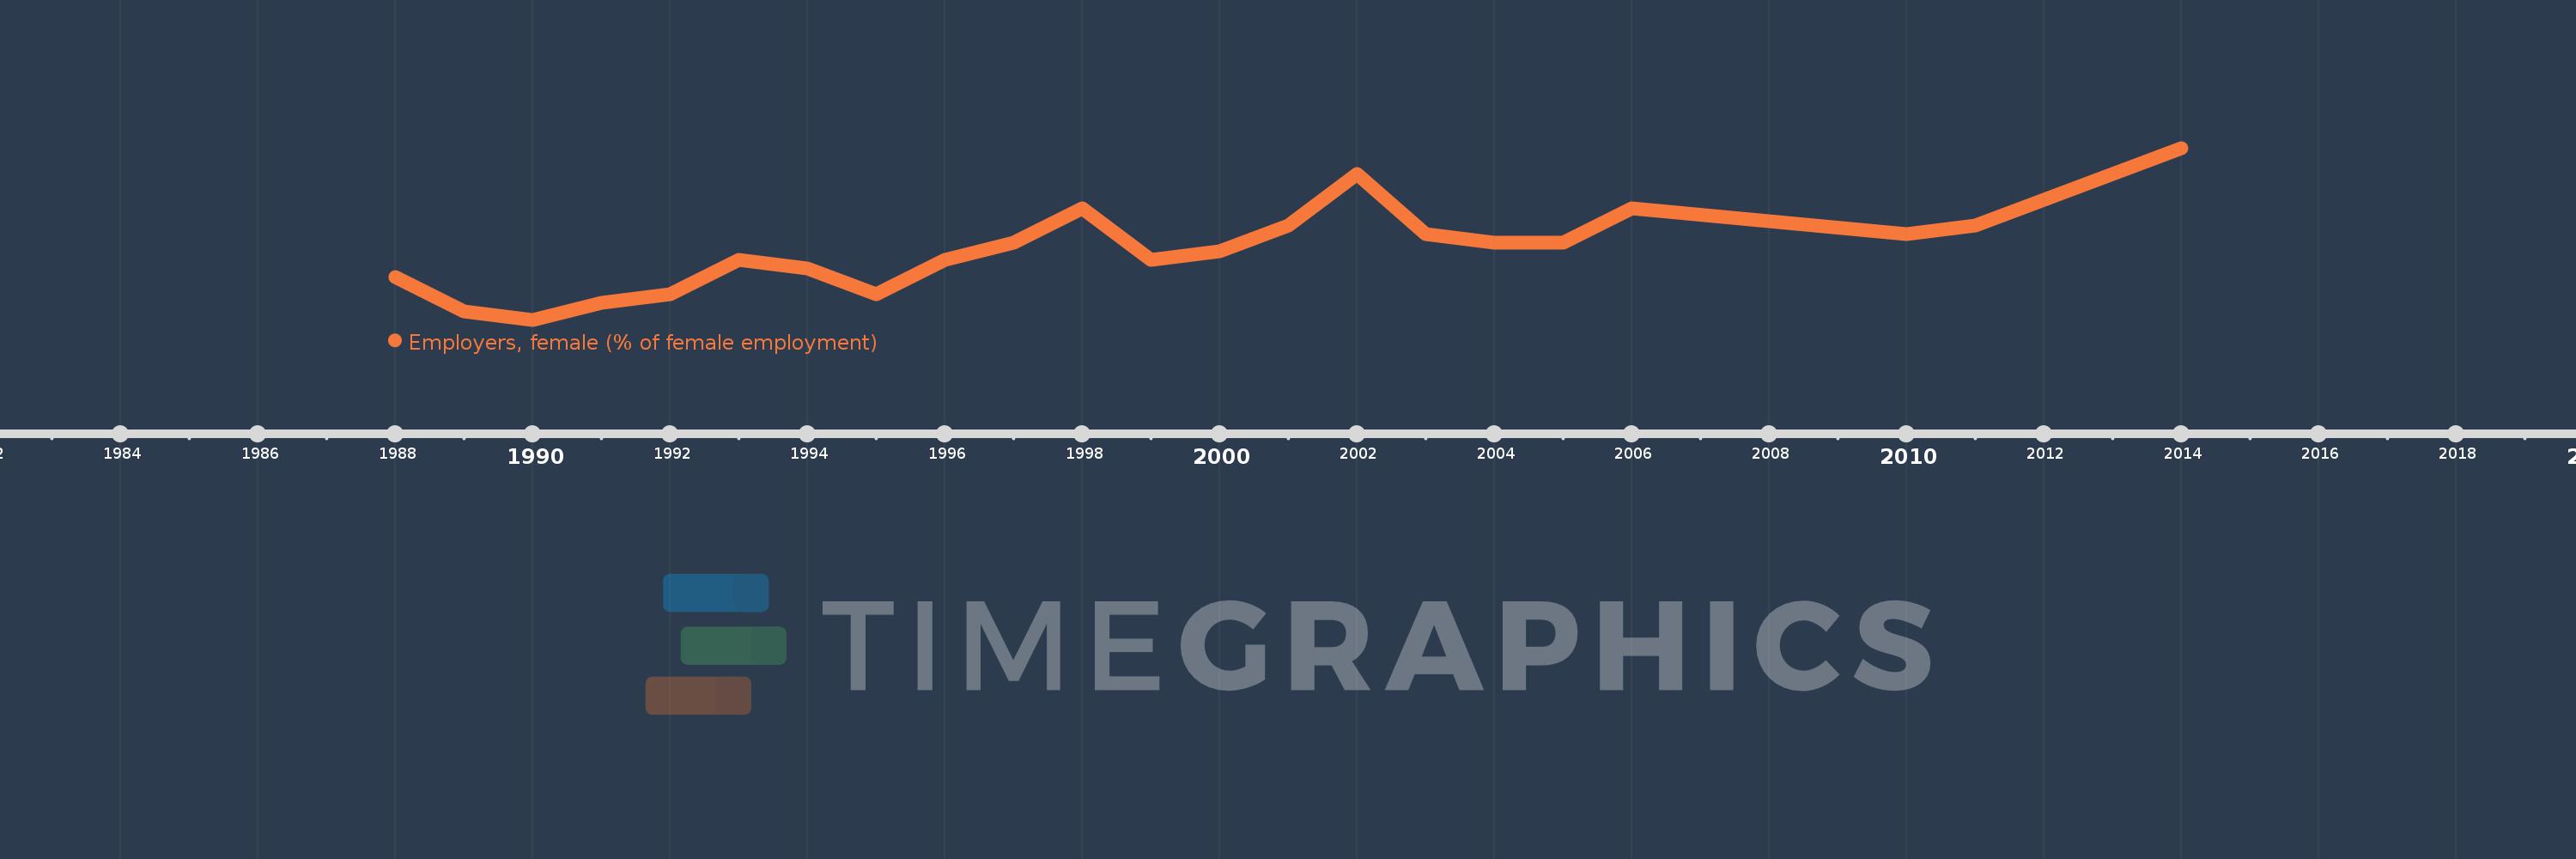
Employers, female (% of female employment)
2014,2011,2010,2006,2005,2004,2003,2002,2001,2000,1999,1998,1997,1996,1995,1994,1993,1992,1991,1990,1989,1988
Estas estadísticas en otros países:
línea de tiempo (timeline):
En esta escala de tiempo se presenta un gráfico de 1988 y 2014 de Trinidad and Tobago. Los datos de 1987 están ausentes. El número de observaciones reales por fecha: 22.
Fuente (nombre):
Indicadores del desarrollo mundial
Fuente (organización):
ILO Key Indicators of the Labour Market (KILM).
Categorías:
Social Protection & Labor, Gender
Se ha actualizado:
23 abr 2017 año
Los indicadores de los cambios de valor en los últimos años
A la fecha de observación
Valor
Cambio absoluto
El cambio con respecto al valor anterior
1 ene 1988 año
2.0
+2.0
0.0%
1 ene 1989 año
1.6
-0.4
-20.0%
1 ene 1990 año
1.5
-0.1
-6.25%
1 ene 1991 año
1.7
+0.2
13.33%
1 ene 1992 año
1.8
+0.1
5.88%
1 ene 1993 año
2.2
+0.4
22.22%
1 ene 1994 año
2.1
-0.1
-4.55%
1 ene 1995 año
1.8
-0.3
-14.29%
1 ene 1996 año
2.2
+0.4
22.22%
1 ene 1997 año
2.4
+0.2
9.09%
1 ene 1998 año
2.8
+0.4
16.67%
1 ene 1999 año
2.2
-0.6
-21.43%
1 ene 2000 año
2.3
+0.1
4.55%
1 ene 2001 año
2.6
+0.3
13.04%
1 ene 2002 año
3.2
+0.6
23.08%
1 ene 2003 año
2.5
-0.7
-21.88%
1 ene 2004 año
2.4
-0.1
-4.0%
1 ene 2005 año
2.4
0.0
0.0%
1 ene 2006 año
2.8
+0.4
16.67%
1 ene 2010 año
2.5
-0.3
-10.71%
1 ene 2011 año
2.6
+0.1
4.0%
1 ene 2014 año
3.5
+0.9
34.62%
Ranking de los países por los datos estadísticos actuales


Comentarios: