30
/es/
AIzaSyAYiBZKx7MnpbEhh9jyipgxe19OcubqV5w
April 1, 2024
262964
Thailand
THA
true
2
1
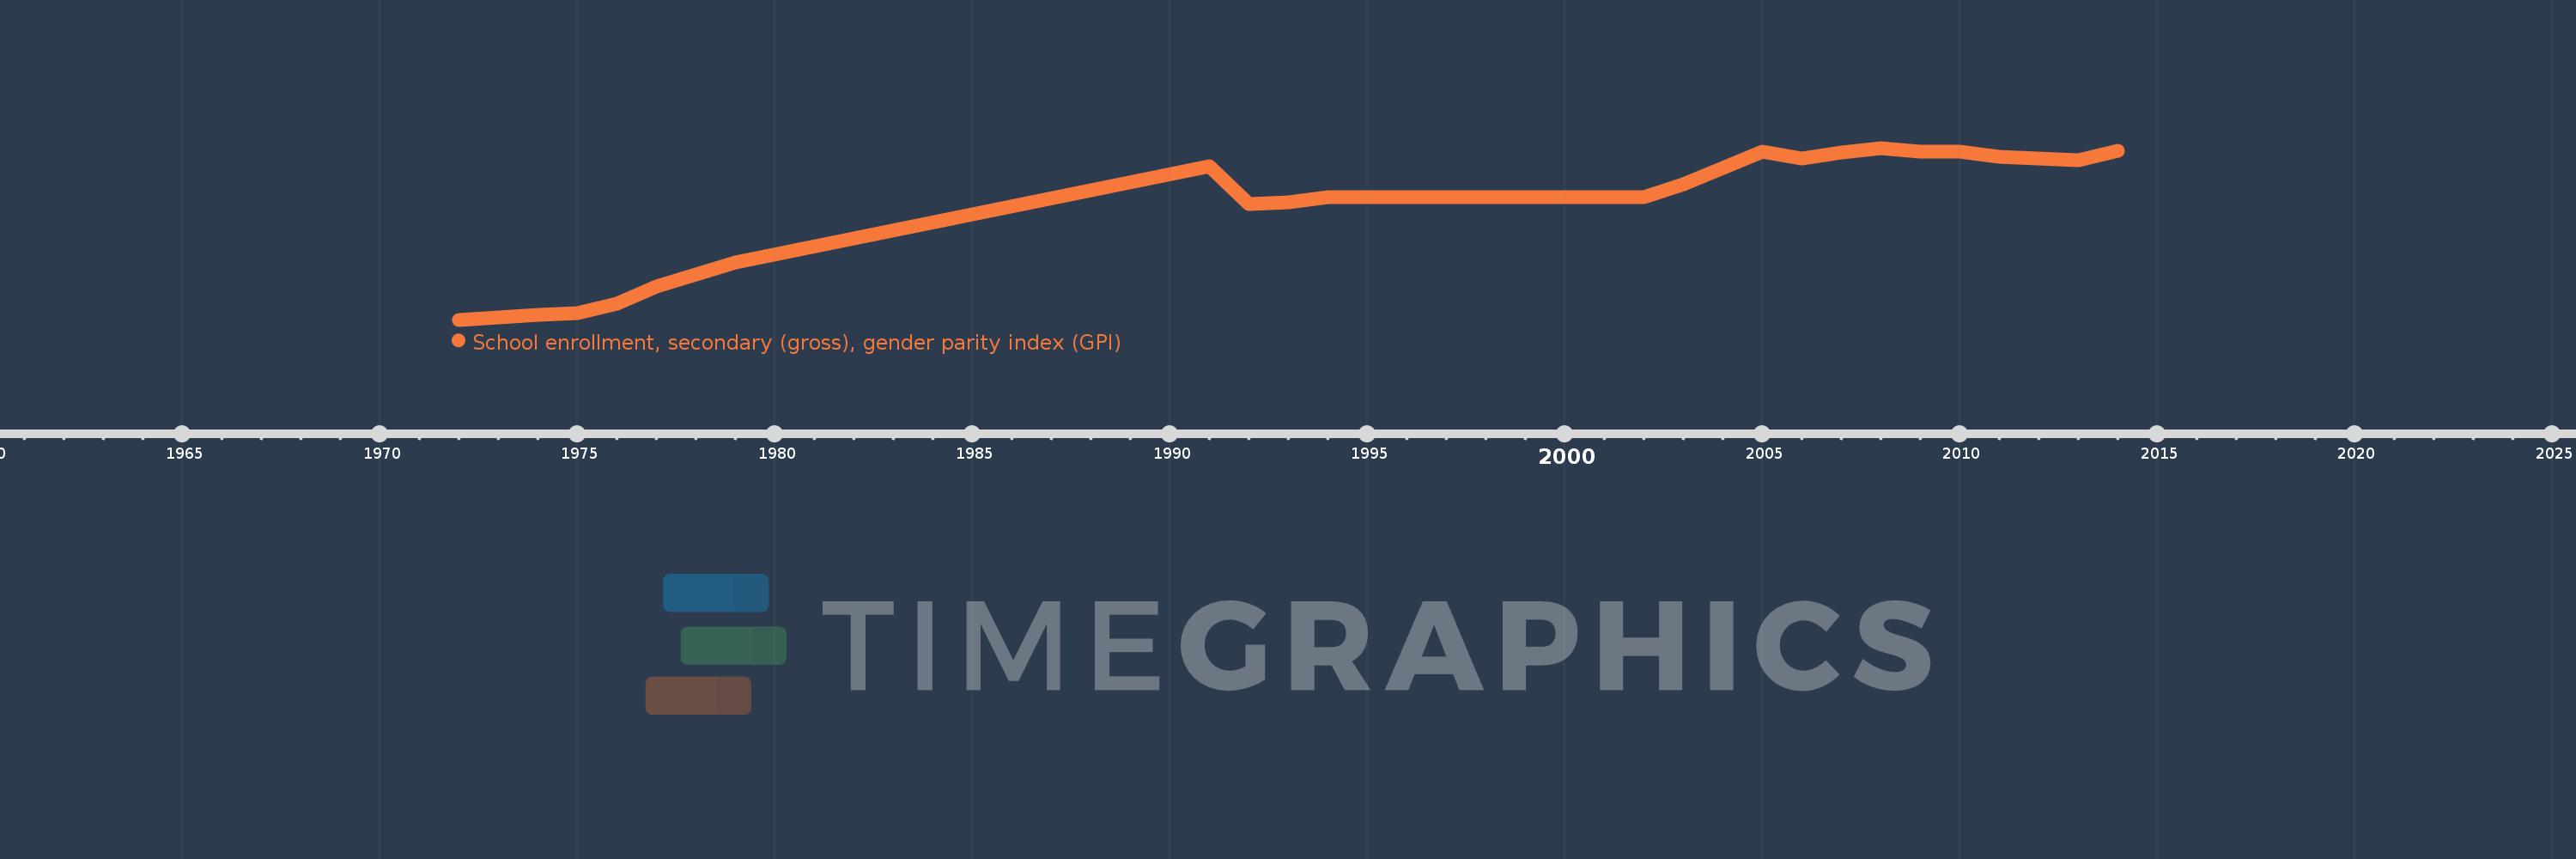
School enrollment, secondary (gross), gender parity index (GPI)
2014,2013,2012,2011,2010,2009,2008,2007,2006,2005,2003,2002,1994,1993,1992,1991,1979,1978,1977,1976,1975,1974,1972
