29
/es/
es
AIzaSyAYiBZKx7MnpbEhh9jyipgxe19OcubqV5w
April 1, 2024
262747
Thailand
THA
true
2
1
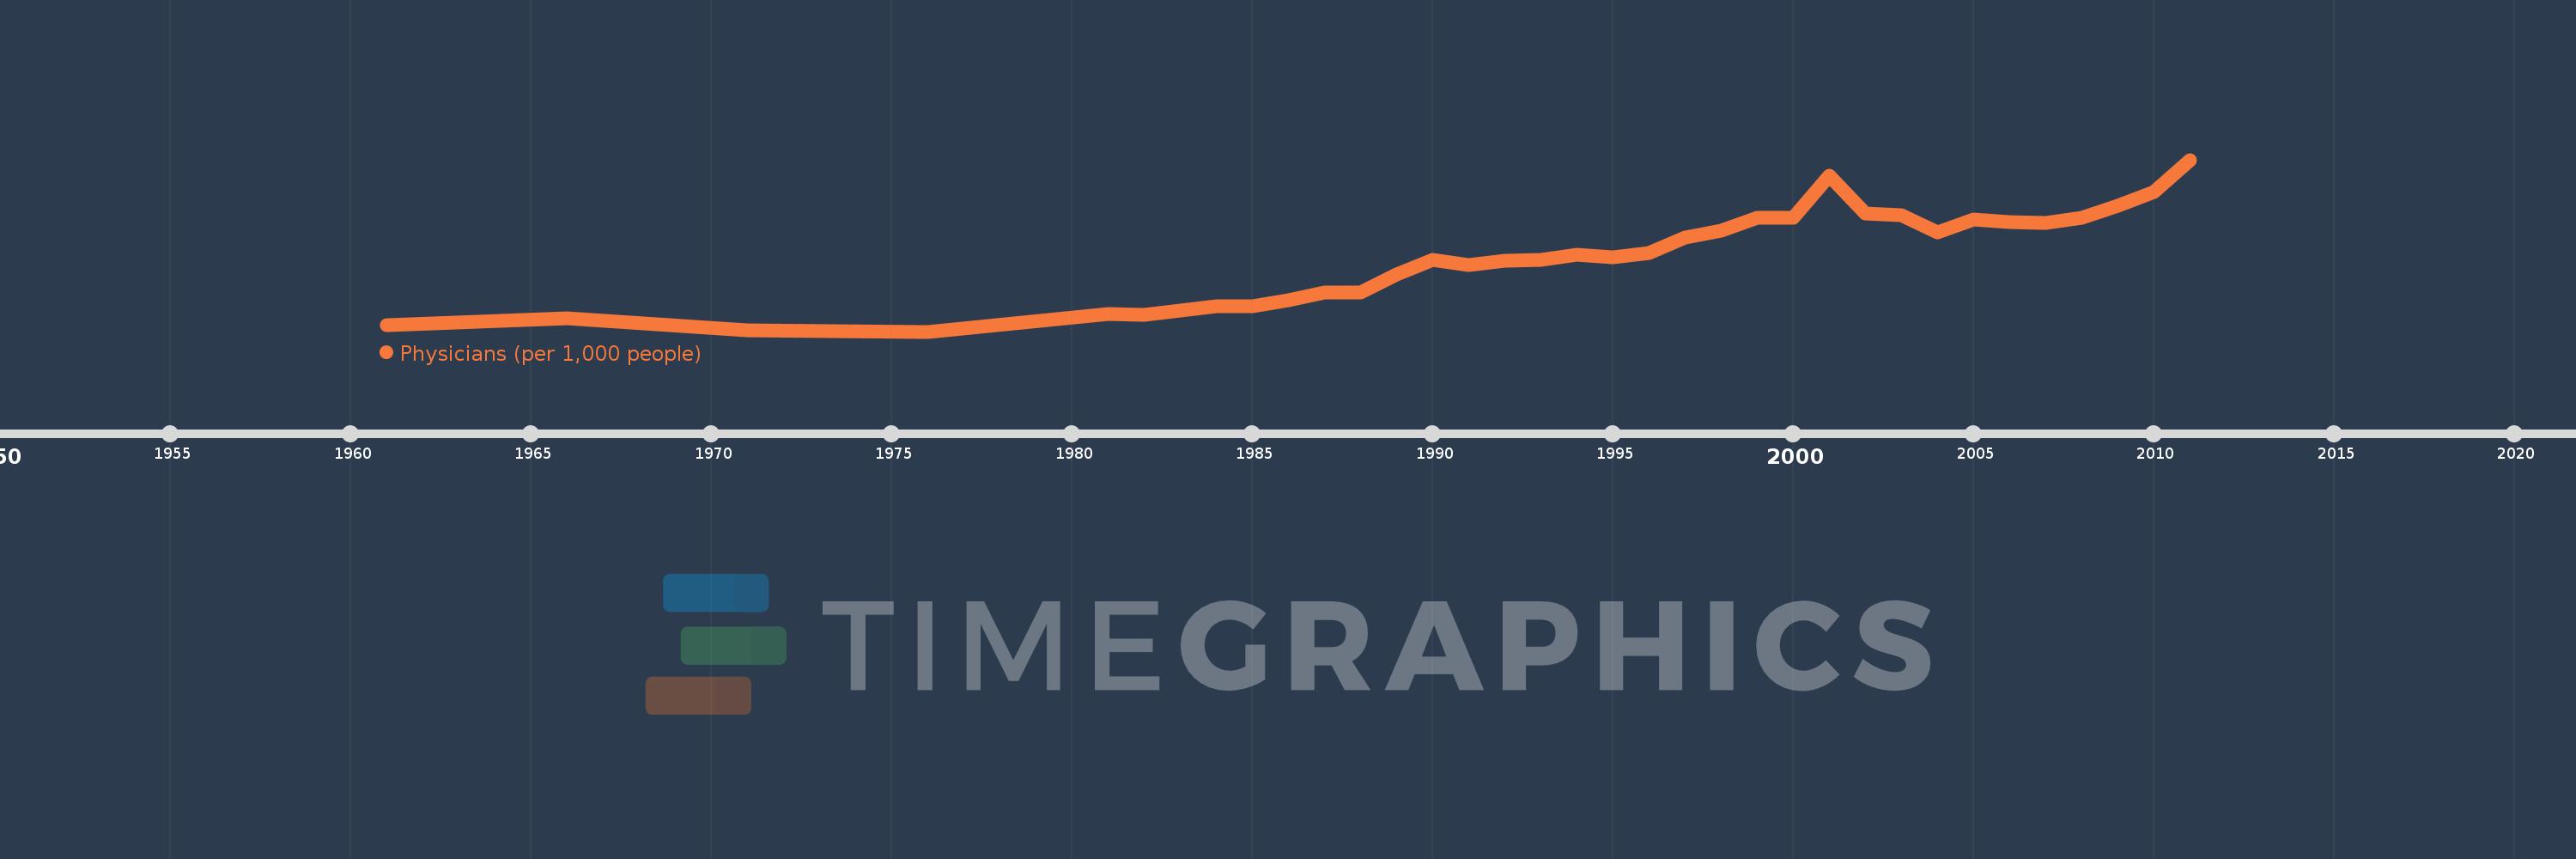
Physicians (per 1,000 people)
2011,2010,2009,2008,2007,2006,2005,2004,2003,2002,2001,2000,1999,1998,1997,1996,1995,1994,1993,1992,1991,1990,1989,1988,1987,1986,1985,1984,1982,1981,1976,1971,1966,1961
Estas estadísticas en otros países:
AfghanistanAlbaniaAlgeriaAmerican SamoaAndorraAngolaAntigua and BarbudaArab WorldArgentinaArmeniaArubaAustraliaAustriaAzerbaijanBahamas, TheBahrainBangladeshBarbadosBelarusBelgiumBelizeBeninBermudaBhutanBoliviaBosnia and HerzegovinaBotswanaBrazilBrunei DarussalamBulgariaBurkina FasoBurundiCabo VerdeCambodiaCameroonCanadaCaribbean small statesCayman IslandsCentral African RepublicCentral Europe and the BalticsChadChannel IslandsChileChinaColombiaComorosCongo, Dem. Rep.Congo, Rep.Costa RicaCote d'IvoireCroatiaCubaCyprusCzech RepublicDenmarkDjiboutiDominicaDominican RepublicEarly-demographic dividendEast Asia & PacificEast Asia & Pacific (excluding high income)East Asia & Pacific (IDA & IBRD countries)EcuadorEgypt, Arab Rep.El SalvadorEquatorial GuineaEritreaEstoniaEthiopiaEuro areaEurope & Central AsiaEurope & Central Asia (excluding high income)Europe & Central Asia (IDA & IBRD countries)European UnionFijiFinlandFragile and conflict affected situationsFranceFrench PolynesiaGabonGambia, TheGeorgiaGermanyGhanaGreeceGreenlandGrenadaGuamGuatemalaGuineaGuinea-BissauGuyanaHaitiHeavily indebted poor countries (HIPC)High incomeHondurasHong Kong SAR, ChinaHungaryIBRD onlyIcelandIDA & IBRD totalIDA blendIDA onlyIDA totalIndiaIndonesiaIran, Islamic Rep.IraqIrelandIsraelItalyJamaicaJapanJordanKazakhstanKenyaKiribatiKorea, Dem. People’s Rep.Korea, Rep.KuwaitKyrgyz RepublicLao PDRLate-demographic dividendLatin America & Caribbean Latin America & Caribbean (excluding high income)Latin America & the Caribbean (IDA & IBRD countries)LatviaLeast developed countries: UN classificationLebanonLesothoLiberiaLibyaLithuaniaLow & middle incomeLow incomeLower middle incomeLuxembourgMacao SAR, ChinaMacedonia, FYRMadagascarMalawiMalaysiaMaldivesMaliMaltaMarshall IslandsMauritaniaMauritiusMexicoMicronesia, Fed. Sts.Middle East & North AfricaMiddle East & North Africa (excluding high income)Middle East & North Africa (IDA & IBRD countries)Middle incomeMoldovaMonacoMongoliaMontenegroMoroccoMozambiqueMyanmarNamibiaNauruNepalNetherlandsNew CaledoniaNew ZealandNicaraguaNigerNigeriaNorth AmericaNorthern Mariana IslandsNorwayOECD membersOmanOther small statesPacific island small statesPakistanPalauPanamaPapua New GuineaParaguayPeruPhilippinesPolandPortugalPost-demographic dividendPre-demographic dividendPuerto RicoQatarRomaniaRussian FederationRwandaSamoaSan MarinoSao Tome and PrincipeSaudi ArabiaSenegalSerbiaSeychellesSierra LeoneSingaporeSlovak RepublicSloveniaSmall statesSolomon IslandsSomaliaSouth AfricaSouth AsiaSouth Asia (IDA & IBRD)SpainSri LankaSt. Kitts and NevisSt. LuciaSt. Vincent and the GrenadinesSub-Saharan Africa Sub-Saharan Africa (excluding high income)Sub-Saharan Africa (IDA & IBRD countries)SudanSurinameSwazilandSwedenSwitzerlandSyrian Arab RepublicTajikistanTanzaniaThailandTimor-LesteTogoTongaTrinidad and TobagoTunisiaTurkeyTurkmenistanTuvaluUgandaUkraineUnited Arab EmiratesUnited KingdomUnited StatesUpper middle incomeUruguayUzbekistanVanuatuVenezuela, RBVietnamVirgin Islands (U.S.)West Bank and GazaWorldYemen, Rep.ZambiaZimbabwe línea de tiempo (timeline):
En esta escala de tiempo se presenta un gráfico de 1961 y 2011 de Thailand. Los datos de 1960 están ausentes. El número de observaciones reales por fecha: 34.
Fuente (nombre):
Indicadores del desarrollo mundial
Fuente (organización):
World Health Organization's Global Health Workforce Statistics, OECD, supplemented by country data.
Categorías:
Health
Se ha actualizado:
23 abr 2017 año
Los indicadores de los cambios de valor en los últimos años
Mínimo:
0.119
1 ene 1976 año
Máximo:
0.393
1 ene 2011 año
A la fecha de observación
Valor
Cambio absoluto
El cambio con respecto al valor anterior
1 ene 1961 año
0.129
+0.129
0.0%
1 ene 1966 año
0.14
+0.011
8.36%
1 ene 1971 año
0.121
-0.019
-13.59%
1 ene 1976 año
0.119
-0.002
-1.33%
1 ene 1981 año
0.147
+0.028
23.43%
1 ene 1982 año
0.146
-0.001
-1.02%
1 ene 1984 año
0.16
+0.014
9.62%
1 ene 1985 año
0.16
+0.0
0.31%
1 ene 1986 año
0.169
+0.009
5.69%
1 ene 1987 año
0.182
+0.013
7.75%
1 ene 1988 año
0.181
-0.001
-0.44%
1 ene 1989 año
0.21
+0.028
15.6%
1 ene 1990 año
0.233
+0.023
11.02%
1 ene 1991 año
0.225
-0.008
-3.22%
1 ene 1992 año
0.232
+0.007
2.97%
1 ene 1993 año
0.234
+0.002
0.73%
1 ene 1994 año
0.241
+0.007
3.12%
1 ene 1995 año
0.238
-0.003
-1.24%
1 ene 1996 año
0.245
+0.007
2.94%
1 ene 1997 año
0.269
+0.024
9.8%
1 ene 1998 año
0.28
+0.011
4.09%
1 ene 1999 año
0.301
+0.021
7.5%
1 ene 2000 año
0.301
0.0
0.0%
1 ene 2001 año
0.368
+0.067
22.26%
1 ene 2002 año
0.308
-0.06
-16.3%
1 ene 2003 año
0.305
-0.003
-0.97%
1 ene 2004 año
0.277
-0.028
-9.18%
1 ene 2005 año
0.298
+0.021
7.58%
1 ene 2006 año
0.293
-0.005
-1.68%
1 ene 2007 año
0.292
-0.001
-0.34%
1 ene 2008 año
0.3
+0.008
2.74%
1 ene 2009 año
0.32
+0.02
6.67%
1 ene 2010 año
0.342
+0.022
6.88%
1 ene 2011 año
0.393
+0.051
14.91%
Ranking de los países por los datos estadísticos actuales


Comentarios: