29
/es/
es
AIzaSyAYiBZKx7MnpbEhh9jyipgxe19OcubqV5w
April 1, 2024
262276
Thailand
THA
true
2
1
Goods and services expense (% of expense)
2016,2015,2014,2013,2012,2011,2010,2009,2008,2007,2006,2005,2004,2003,2002,2001,2000,1999,1998,1997,1996,1995,1994,1993,1992,1991,1990,1989,1988,1987,1986,1985,1984,1983,1982,1981,1980,1979,1978,1977,1976,1975,1974,1973
Estas estadísticas en otros países:
AfghanistanAlbaniaAlgeriaAngolaAntigua and BarbudaArab WorldArmeniaAustraliaAustriaAzerbaijanBahamas, TheBahrainBangladeshBarbadosBelarusBelgiumBelizeBeninBhutanBoliviaBosnia and HerzegovinaBotswanaBrazilBulgariaBurkina FasoBurundiCabo VerdeCambodiaCanadaCaribbean small statesCentral African RepublicCentral Europe and the BalticsChileColombiaCongo, Dem. Rep.Congo, Rep.Costa RicaCote d'IvoireCroatiaCyprusCzech RepublicDenmarkDominicaDominican RepublicEarly-demographic dividendEast Asia & PacificEast Asia & Pacific (excluding high income)East Asia & Pacific (IDA & IBRD countries)Egypt, Arab Rep.El SalvadorEquatorial GuineaEstoniaEthiopiaEuro areaEurope & Central AsiaEurope & Central Asia (excluding high income)Europe & Central Asia (IDA & IBRD countries)European UnionFijiFinlandFranceGambia, TheGeorgiaGermanyGhanaGreeceGrenadaGuatemalaHeavily indebted poor countries (HIPC)High incomeHondurasHong Kong SAR, ChinaHungaryIBRD onlyIcelandIDA & IBRD totalIDA blendIDA onlyIDA totalIndiaIndonesiaIran, Islamic Rep.IraqIrelandIsraelItalyJamaicaJapanJordanKazakhstanKenyaKiribatiKorea, Rep.KuwaitKyrgyz RepublicLao PDRLate-demographic dividendLatin America & Caribbean Latin America & Caribbean (excluding high income)Latin America & the Caribbean (IDA & IBRD countries)LatviaLeast developed countries: UN classificationLebanonLesothoLiberiaLithuaniaLow & middle incomeLow incomeLower middle incomeLuxembourgMacao SAR, ChinaMacedonia, FYRMadagascarMalawiMalaysiaMaldivesMaliMaltaMauritiusMexicoMicronesia, Fed. Sts.Middle East & North AfricaMiddle East & North Africa (excluding high income)Middle East & North Africa (IDA & IBRD countries)Middle incomeMoldovaMongoliaMoroccoMozambiqueNamibiaNepalNetherlandsNew ZealandNicaraguaNigeriaNorth AmericaNorwayOECD membersOmanOther small statesPakistanPanamaPapua New GuineaParaguayPeruPhilippinesPolandPortugalPost-demographic dividendPre-demographic dividendQatarRomaniaRussian FederationRwandaSamoaSan MarinoSao Tome and PrincipeSenegalSerbiaSeychellesSierra LeoneSingaporeSlovak RepublicSloveniaSmall statesSolomon IslandsSouth AfricaSouth AsiaSouth Asia (IDA & IBRD)SpainSri LankaSt. Kitts and NevisSt. LuciaSub-Saharan Africa Sub-Saharan Africa (excluding high income)Sub-Saharan Africa (IDA & IBRD countries)SurinameSwazilandSwedenSwitzerlandSyrian Arab RepublicTajikistanTanzaniaThailandTimor-LesteTogoTrinidad and TobagoTunisiaTurkeyUgandaUkraineUnited Arab EmiratesUnited KingdomUnited StatesUpper middle incomeUruguayVanuatuVenezuela, RBWest Bank and GazaWorldYemen, Rep.ZambiaZimbabwe línea de tiempo (timeline):
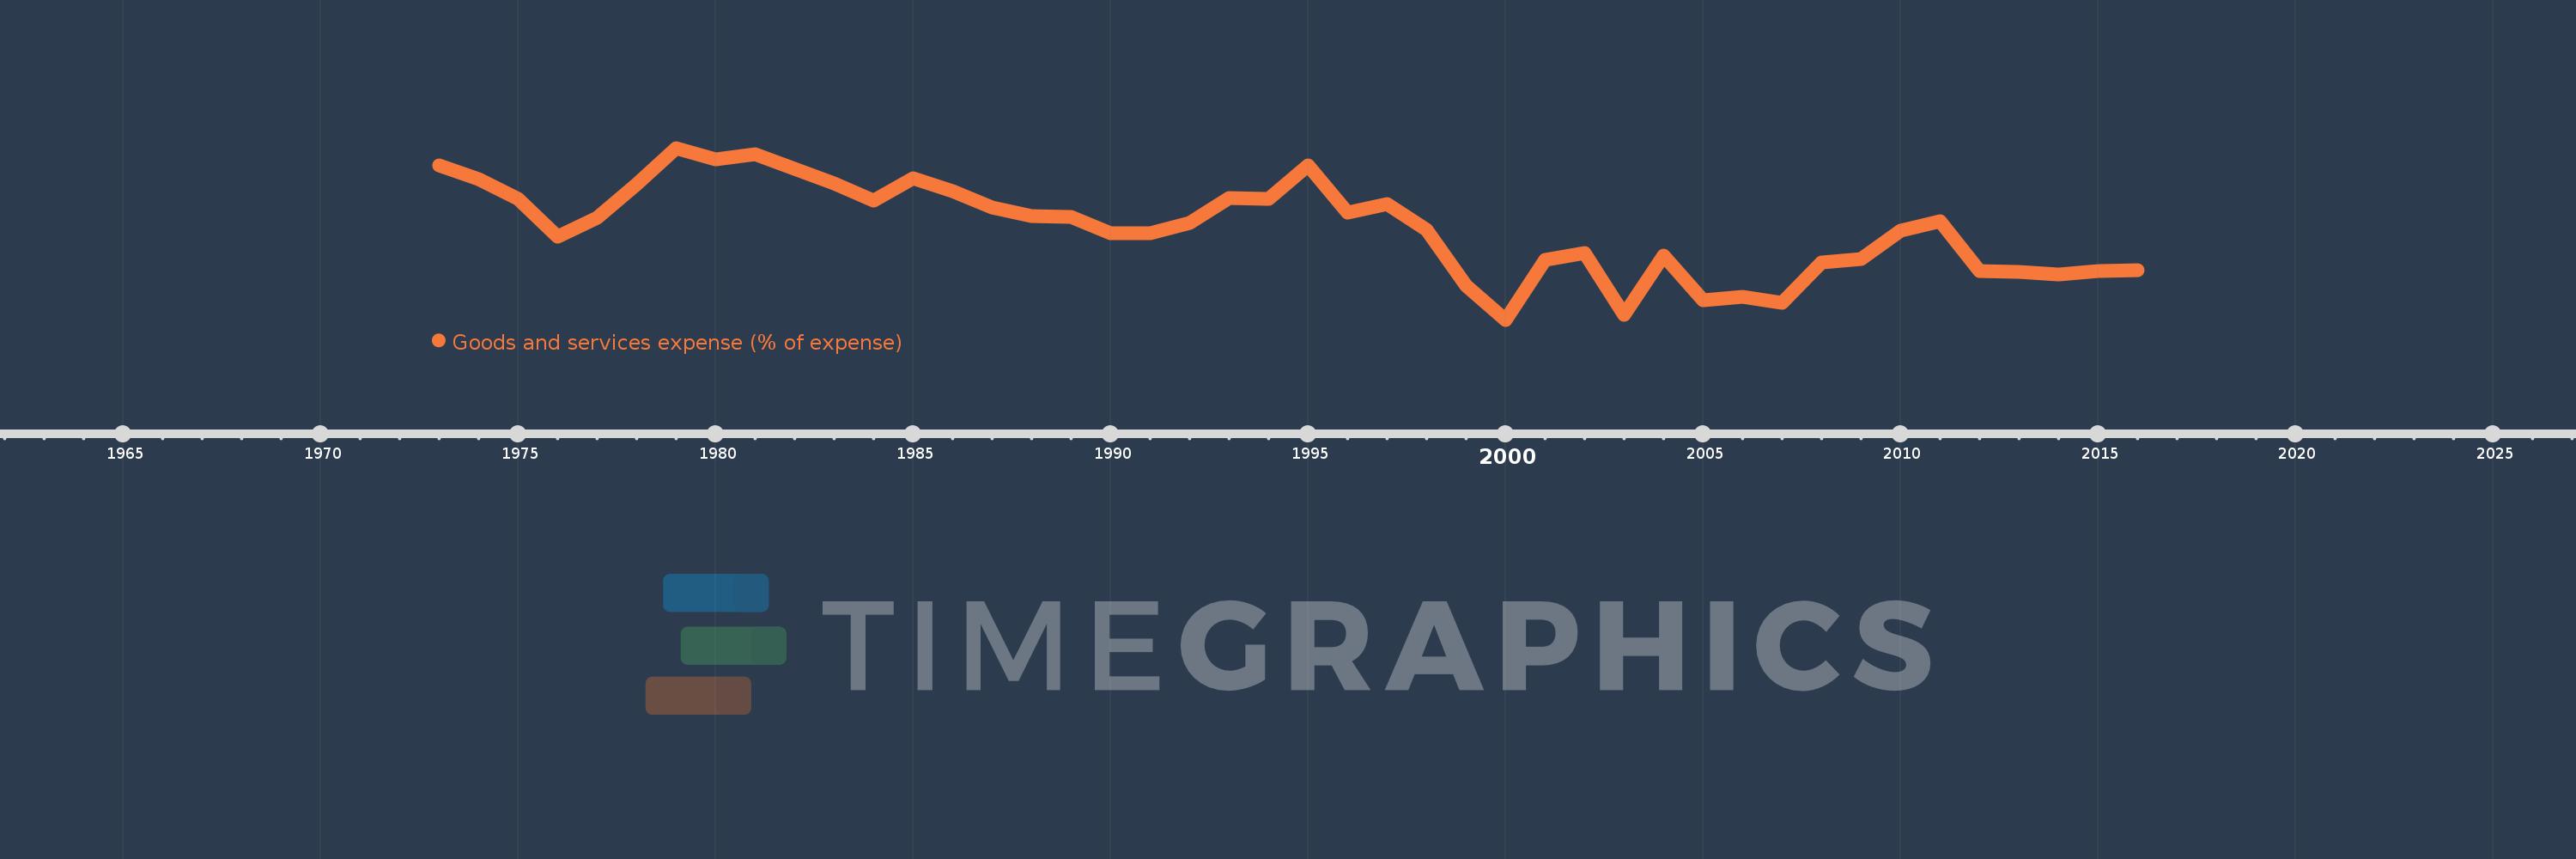
En esta escala de tiempo se presenta un gráfico de 1973 y 2016 de Thailand. Los datos de 1972 están ausentes. El número de observaciones reales por fecha: 44.
Fuente (nombre):
Indicadores del desarrollo mundial
Fuente (organización):
International Monetary Fund, Government Finance Statistics Yearbook and data files.
Categorías:
Public Sector
Se ha actualizado:
23 abr 2017 año
Los indicadores de los cambios de valor en los últimos años
Mínimo:
18.554
1 ene 2000 año
Máximo:
42.333
1 ene 1979 año
A la fecha de observación
Valor
Cambio absoluto
El cambio con respecto al valor anterior
1 ene 1973 año
39.873
+39.873
0.0%
1 ene 1974 año
38.062
-1.811
-4.54%
1 ene 1975 año
35.242
-2.82
-7.41%
1 ene 1976 año
30.044
-5.197
-14.75%
1 ene 1977 año
32.634
+2.59
8.62%
1 ene 1978 año
37.348
+4.714
14.44%
1 ene 1979 año
42.333
+4.985
13.35%
1 ene 1980 año
40.81
-1.524
-3.6%
1 ene 1981 año
41.416
+0.606
1.49%
1 ene 1982 año
39.472
-1.944
-4.69%
1 ene 1983 año
37.407
-2.066
-5.23%
1 ene 1984 año
34.989
-2.418
-6.46%
1 ene 1985 año
38.183
+3.195
9.13%
1 ene 1986 año
36.364
-1.82
-4.77%
1 ene 1987 año
34.15
-2.213
-6.09%
1 ene 1988 año
32.901
-1.249
-3.66%
1 ene 1989 año
32.737
-0.165
-0.5%
1 ene 1990 año
30.506
-2.231
-6.81%
1 ene 1991 año
30.485
-0.021
-0.07%
1 ene 1992 año
31.939
+1.454
4.77%
1 ene 1993 año
35.353
+3.414
10.69%
1 ene 1994 año
35.327
-0.027
-0.08%
1 ene 1995 año
39.882
+4.555
12.89%
1 ene 1996 año
33.423
-6.459
-16.2%
1 ene 1997 año
34.603
+1.18
3.53%
1 ene 1998 año
30.982
-3.62
-10.46%
1 ene 1999 año
23.235
-7.747
-25.0%
1 ene 2000 año
18.554
-4.681
-20.15%
1 ene 2001 año
26.851
+8.297
44.72%
1 ene 2002 año
27.774
+0.923
3.44%
1 ene 2003 año
19.206
-8.568
-30.85%
1 ene 2004 año
27.478
+8.273
43.07%
1 ene 2005 año
21.256
-6.222
-22.64%
1 ene 2006 año
21.708
+0.451
2.12%
1 ene 2007 año
20.879
-0.829
-3.82%
1 ene 2008 año
26.533
+5.655
27.08%
1 ene 2009 año
27.0
+0.467
1.76%
1 ene 2010 año
30.835
+3.834
14.2%
1 ene 2011 año
32.233
+1.398
4.53%
1 ene 2012 año
25.247
-6.986
-21.67%
1 ene 2013 año
25.187
-0.06
-0.24%
1 ene 2014 año
24.767
-0.42
-1.67%
1 ene 2015 año
25.252
+0.485
1.96%
1 ene 2016 año
25.42
+0.167
0.66%
Ranking de los países por los datos estadísticos actuales


Comentarios: