29
/es/
es
AIzaSyAYiBZKx7MnpbEhh9jyipgxe19OcubqV5w
April 1, 2024
25842
Central Europe and the Baltics
CEB
false
2
1
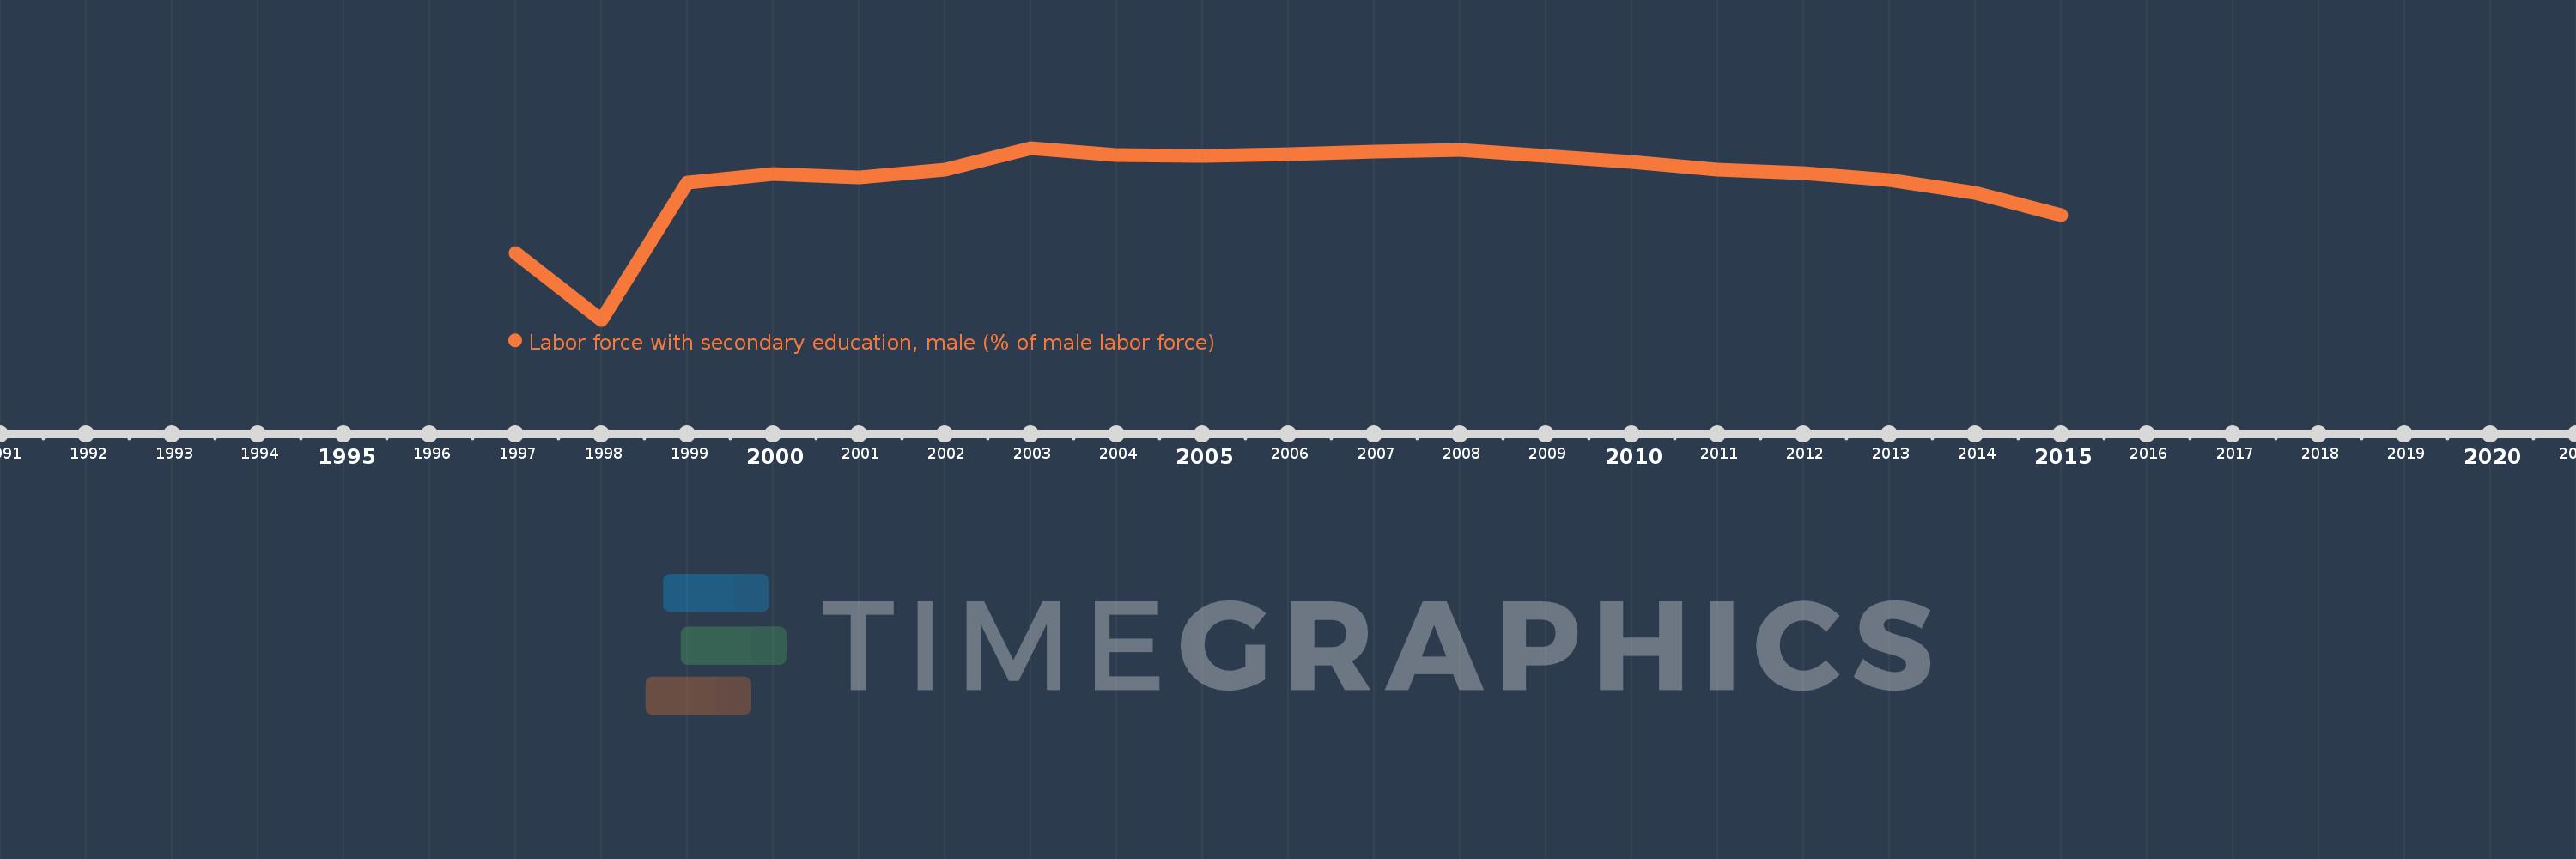
Labor force with secondary education, male (% of male labor force)
2015,2014,2013,2012,2011,2010,2009,2008,2007,2006,2005,2004,2003,2002,2001,2000,1999,1998,1997
Estas estadísticas en otros países:
línea de tiempo (timeline):
En esta escala de tiempo se presenta un gráfico de 1997 y 2015 de Central Europe and the Baltics. Los datos de 1996 están ausentes. El número de observaciones reales por fecha: 19.
Fuente (nombre):
Indicadores del desarrollo mundial
Fuente (organización):
International Labour Organization, Key Indicators of the Labour Market database.
Categorías:
Education, Social Protection & Labor, Gender
Se ha actualizado:
23 abr 2017 año
Los indicadores de los cambios de valor en los últimos años
Mínimo:
60.964
1 ene 1998 año
Máximo:
70.042
1 ene 2003 año
A la fecha de observación
Valor
Cambio absoluto
El cambio con respecto al valor anterior
1 ene 1997 año
64.513
+64.513
0.0%
1 ene 1998 año
60.964
-3.549
-5.5%
1 ene 1999 año
68.193
+7.229
11.86%
1 ene 2000 año
68.68
+0.487
0.71%
1 ene 2001 año
68.49
-0.189
-0.28%
1 ene 2002 año
68.882
+0.392
0.57%
1 ene 2003 año
70.042
+1.16
1.68%
1 ene 2004 año
69.663
-0.379
-0.54%
1 ene 2005 año
69.613
-0.05
-0.07%
1 ene 2006 año
69.716
+0.103
0.15%
1 ene 2007 año
69.85
+0.134
0.19%
1 ene 2008 año
69.919
+0.069
0.1%
1 ene 2009 año
69.632
-0.287
-0.41%
1 ene 2010 año
69.283
-0.349
-0.5%
1 ene 2011 año
68.888
-0.394
-0.57%
1 ene 2012 año
68.708
-0.18
-0.26%
1 ene 2013 año
68.351
-0.357
-0.52%
1 ene 2014 año
67.649
-0.702
-1.03%
1 ene 2015 año
66.479
-1.169
-1.73%
Ranking de los países por los datos estadísticos actuales


Comentarios: