30
/es/
AIzaSyAYiBZKx7MnpbEhh9jyipgxe19OcubqV5w
April 1, 2024
257018
Switzerland
CHE
true
2
1
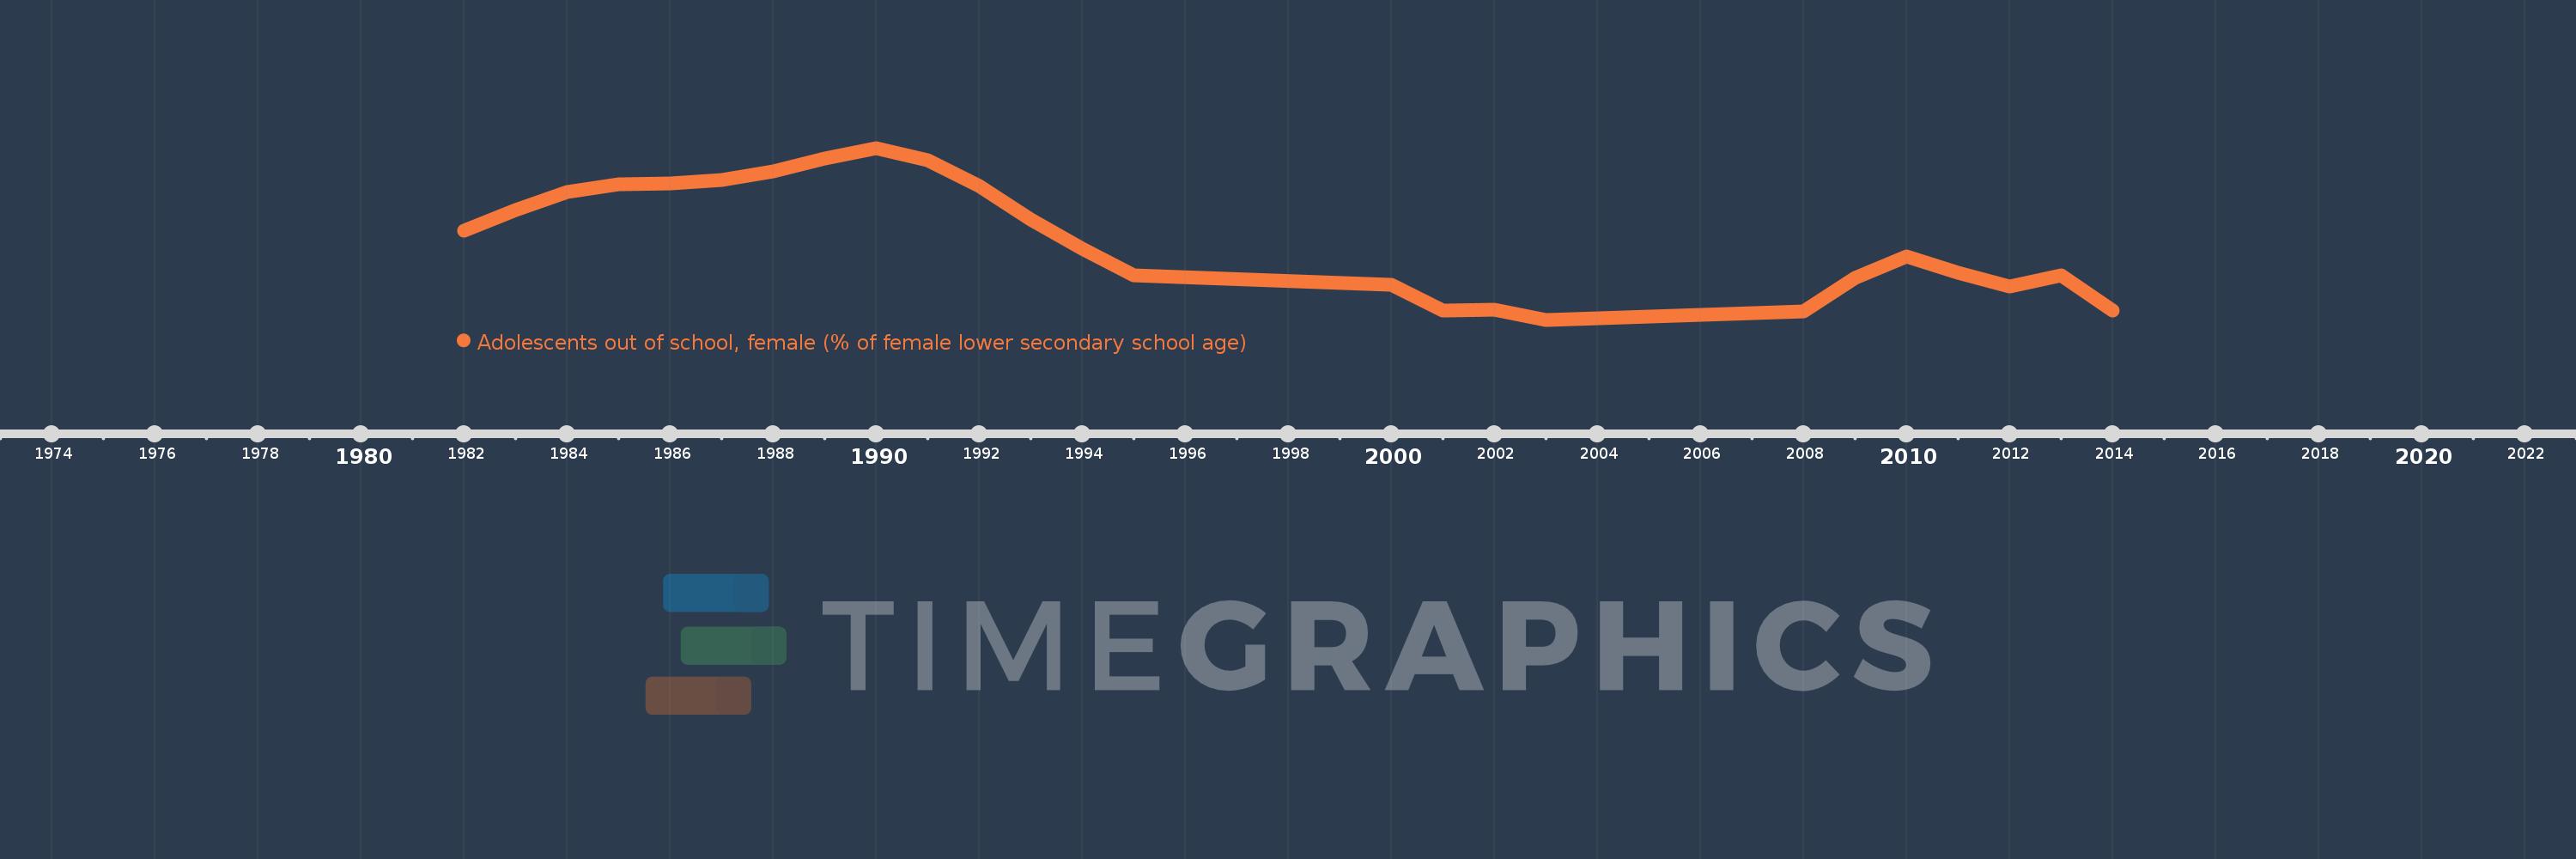
Adolescents out of school, female (% of female lower secondary school age)
2014,2013,2012,2011,2010,2009,2008,2003,2002,2001,2000,1995,1994,1993,1992,1991,1990,1989,1988,1987,1986,1985,1984,1983,1982
