29
/es/
es
AIzaSyAYiBZKx7MnpbEhh9jyipgxe19OcubqV5w
April 1, 2024
256354
Sweden
SWE
true
2
1
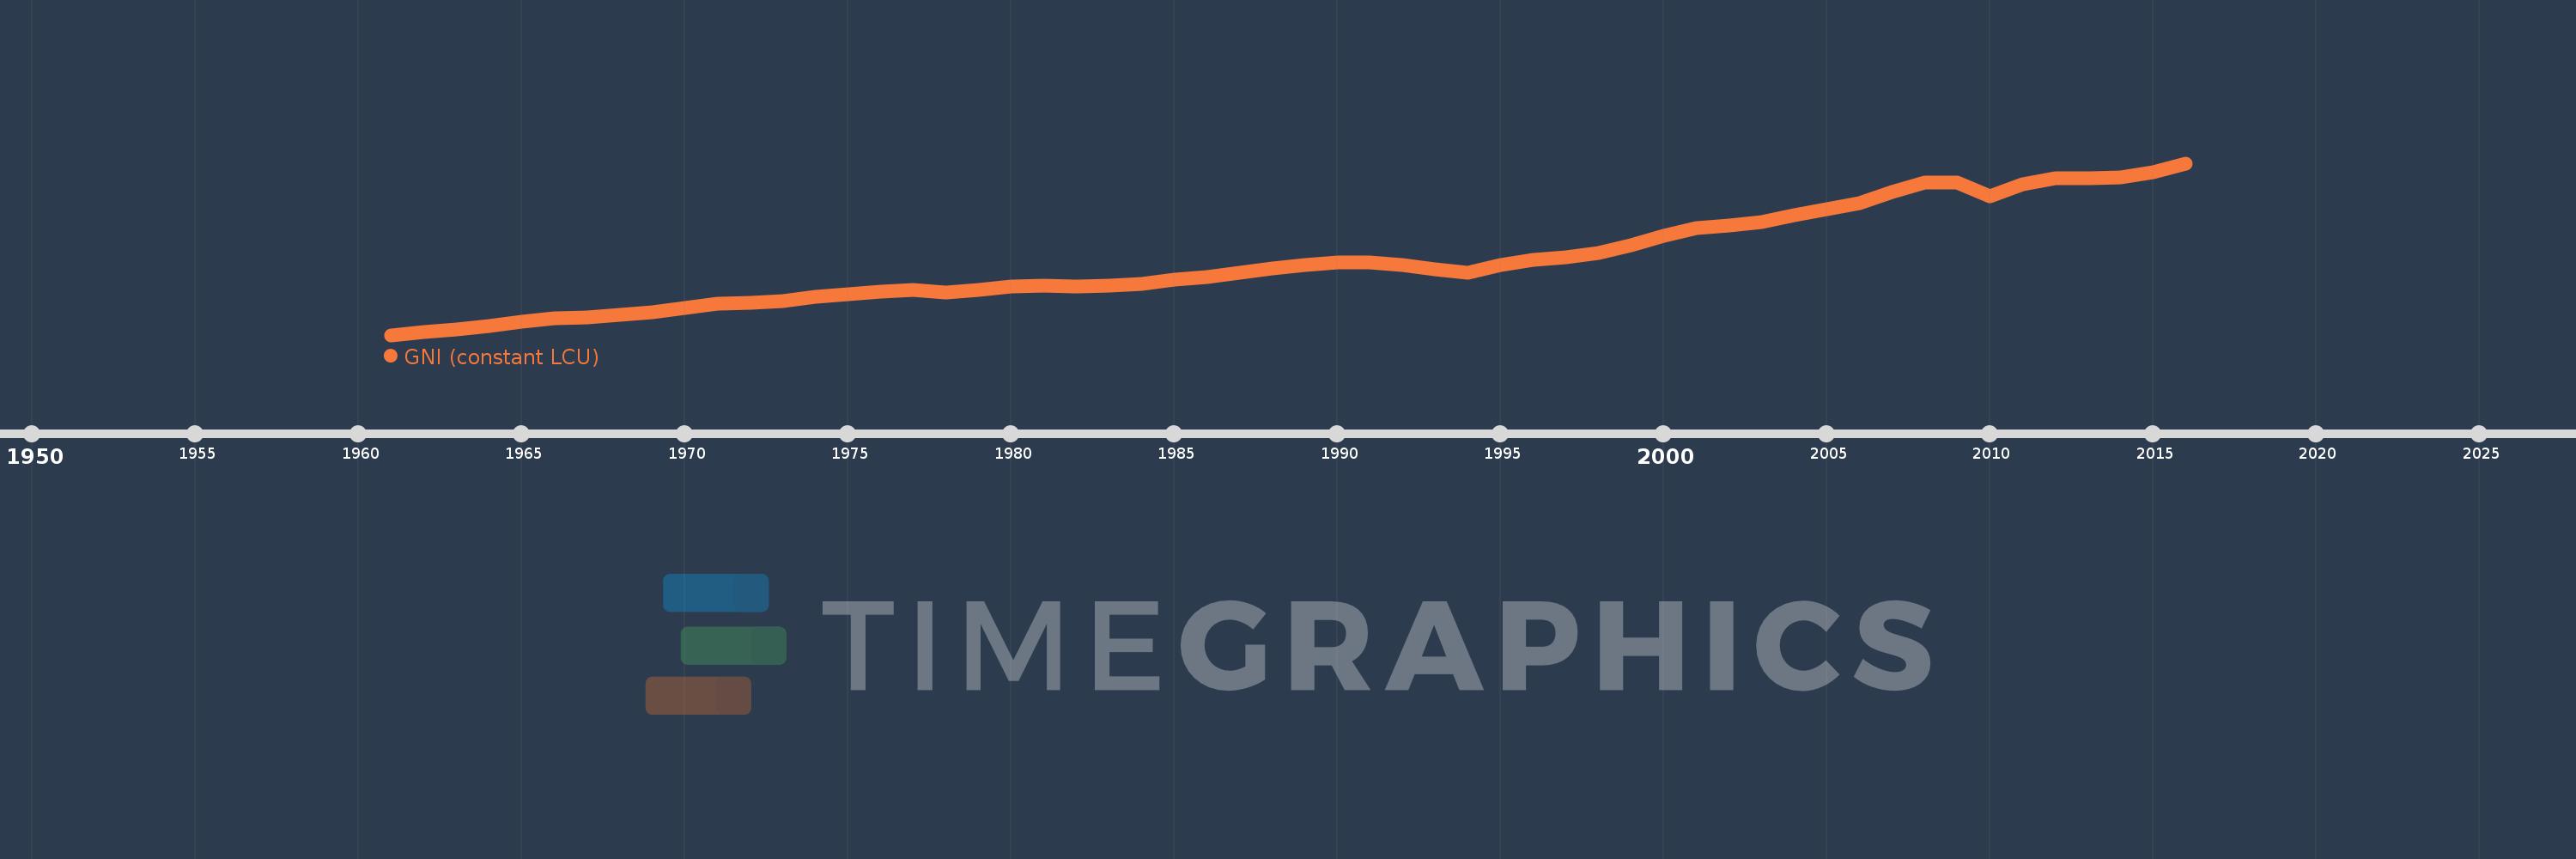
GNI (constant LCU)
2016,2015,2014,2013,2012,2011,2010,2009,2008,2007,2006,2005,2004,2003,2002,2001,2000,1999,1998,1997,1996,1995,1994,1993,1992,1991,1990,1989,1988,1987,1986,1985,1984,1983,1982,1981,1980,1979,1978,1977,1976,1975,1974,1973,1972,1971,1970,1969,1968,1967,1966,1965,1964,1963,1962,1961
Estas estadísticas en otros países:
AlbaniaAlgeriaAngolaAntigua and BarbudaArgentinaArmeniaAustraliaAustriaAzerbaijanBahamas, TheBahrainBangladeshBarbadosBelarusBelgiumBelizeBeninBhutanBoliviaBosnia and HerzegovinaBotswanaBrazilBrunei DarussalamBulgariaBurkina FasoBurundiCabo VerdeCambodiaCameroonCanadaChadChileChinaColombiaComorosCongo, Dem. Rep.Congo, Rep.Costa RicaCote d'IvoireCroatiaCubaCyprusCzech RepublicDenmarkDjiboutiDominican RepublicEcuadorEgypt, Arab Rep.El SalvadorEquatorial GuineaEritreaEstoniaEthiopiaFijiFinlandFranceGabonGambia, TheGeorgiaGermanyGhanaGreeceGuatemalaGuineaGuinea-BissauHaitiHondurasHong Kong SAR, ChinaHungaryIcelandIndiaIndonesiaIran, Islamic Rep.IrelandIsraelItalyJamaicaJapanJordanKazakhstanKenyaKorea, Rep.KosovoKuwaitKyrgyz RepublicLao PDRLatviaLebanonLiberiaLibyaLithuaniaLuxembourgMacao SAR, ChinaMacedonia, FYRMadagascarMalawiMalaysiaMaliMaltaMauritaniaMauritiusMexicoMoldovaMongoliaMontenegroMoroccoMozambiqueMyanmarNamibiaNepalNetherlandsNew ZealandNicaraguaNigerNigeriaNorwayOmanPakistanPanamaPapua New GuineaParaguayPeruPhilippinesPolandPortugalPuerto RicoQatarRomaniaRussian FederationRwandaSamoaSaudi ArabiaSenegalSerbiaSeychellesSierra LeoneSingaporeSlovak RepublicSloveniaSomaliaSouth AfricaSouth SudanSpainSri LankaSudanSurinameSwazilandSwedenSwitzerlandSyrian Arab RepublicTajikistanTanzaniaThailandTimor-LesteTogoTrinidad and TobagoTunisiaTurkeyTurkmenistanUgandaUkraineUnited Arab EmiratesUnited KingdomUnited StatesUruguayUzbekistanVanuatuVenezuela, RBVietnamWest Bank and GazaZambiaZimbabwe línea de tiempo (timeline):
En esta escala de tiempo se presenta un gráfico de 1961 y 2016 de Sweden. Los datos de 1960 están ausentes. El número de observaciones reales por fecha: 56.
Fuente (nombre):
Indicadores del desarrollo mundial
Fuente (organización):
World Bank national accounts data, and OECD National Accounts data files.
Categorías:
Economy & Growth
Se ha actualizado:
23 abr 2017 año
Los indicadores de los cambios de valor en los últimos años
En promedio:
2.281 billones
Mínimo:
994.769 bn
1 ene 1961 año
Máximo:
3.987 billones
1 ene 2016 año
A la fecha de observación
Valor
Cambio absoluto
El cambio con respecto al valor anterior
1 ene 1961 año
994.769 bn
+994.769 bn
0.0%
1 ene 1962 año
1.051 billones
+56.149 bn
5.64%
1 ene 1963 año
1.096 billones
+44.928 bn
4.28%
1 ene 1964 año
1.154 billones
+57.978 bn
5.29%
1 ene 1965 año
1.233 billones
+79.612 bn
6.9%
1 ene 1966 año
1.28 billones
+46.558 bn
3.77%
1 ene 1967 año
1.306 billones
+26.343 bn
2.06%
1 ene 1968 año
1.35 billones
+43.247 bn
3.31%
1 ene 1969 año
1.398 billones
+48.592 bn
3.6%
1 ene 1970 año
1.468 billones
+69.595 bn
4.98%
1 ene 1971 año
1.538 billones
+70.057 bn
4.77%
1 ene 1972 año
1.555 billones
+16.788 bn
1.09%
1 ene 1973 año
1.592 billones
+36.947 bn
2.38%
1 ene 1974 año
1.658 billones
+66.404 bn
4.17%
1 ene 1975 año
1.711 billones
+52.725 bn
3.18%
1 ene 1976 año
1.754 billones
+43.465 bn
2.54%
1 ene 1977 año
1.773 billones
+18.765 bn
1.07%
1 ene 1978 año
1.741 billones
-31.638 bn
-1.78%
1 ene 1979 año
1.774 billones
+32.388 bn
1.86%
1 ene 1980 año
1.842 billones
+68.669 bn
3.87%
1 ene 1981 año
1.849 billones
+6.686 bn
0.36%
1 ene 1982 año
1.845 billones
-3.914 bn
-0.21%
1 ene 1983 año
1.854 billones
+9.147 bn
0.5%
1 ene 1984 año
1.882 billones
+27.302 bn
1.47%
1 ene 1985 año
1.962 billones
+80.428 bn
4.27%
1 ene 1986 año
2.004 billones
+41.873 bn
2.13%
1 ene 1987 año
2.074 billones
+70.598 bn
3.52%
1 ene 1988 año
2.158 billones
+83.455 bn
4.02%
1 ene 1989 año
2.211 billones
+52.71 bn
2.44%
1 ene 1990 año
2.263 billones
+52.367 bn
2.37%
1 ene 1991 año
2.259 billones
-3.522 bn
-0.16%
1 ene 1992 año
2.21 billones
-49.198 bn
-2.18%
1 ene 1993 año
2.142 billones
-68.125 bn
-3.08%
1 ene 1994 año
2.08 billones
-62.158 bn
-2.9%
1 ene 1995 año
2.218 billones
+137.881 bn
6.63%
1 ene 1996 año
2.31 billones
+92.587 bn
4.17%
1 ene 1997 año
2.35 billones
+39.91 bn
1.73%
1 ene 1998 año
2.421 billones
+70.281 bn
2.99%
1 ene 1999 año
2.552 billones
+130.927 bn
5.41%
1 ene 2000 año
2.723 billones
+171.161 bn
6.71%
1 ene 2001 año
2.858 billones
+135.64 bn
4.98%
1 ene 2002 año
2.904 billones
+45.264 bn
1.58%
1 ene 2003 año
2.969 billones
+65.734 bn
2.26%
1 ene 2004 año
3.085 billones
+115.563 bn
3.89%
1 ene 2005 año
3.182 billones
+97.116 bn
3.15%
1 ene 2006 año
3.298 billones
+115.568 bn
3.63%
1 ene 2007 año
3.487 billones
+189.091 bn
5.73%
1 ene 2008 año
3.648 billones
+160.958 bn
4.62%
1 ene 2009 año
3.645 billones
-2.788 bn
-0.08%
1 ene 2010 año
3.407 billones
-238.273 bn
-6.54%
1 ene 2011 año
3.623 billones
+216.548 bn
6.36%
1 ene 2012 año
3.721 billones
+98.12 bn
2.71%
1 ene 2013 año
3.72 billones
-1.101 bn
-0.03%
1 ene 2014 año
3.746 billones
+25.924 bn
0.7%
1 ene 2015 año
3.827 billones
+80.44 bn
2.15%
1 ene 2016 año
3.987 billones
+160.239 bn
4.19%
Ranking de los países por los datos estadísticos actuales


Comentarios: