29
/es/
es
AIzaSyAYiBZKx7MnpbEhh9jyipgxe19OcubqV5w
April 1, 2024
252348
St. Vincent and the Grenadines
VCT
true
2
1
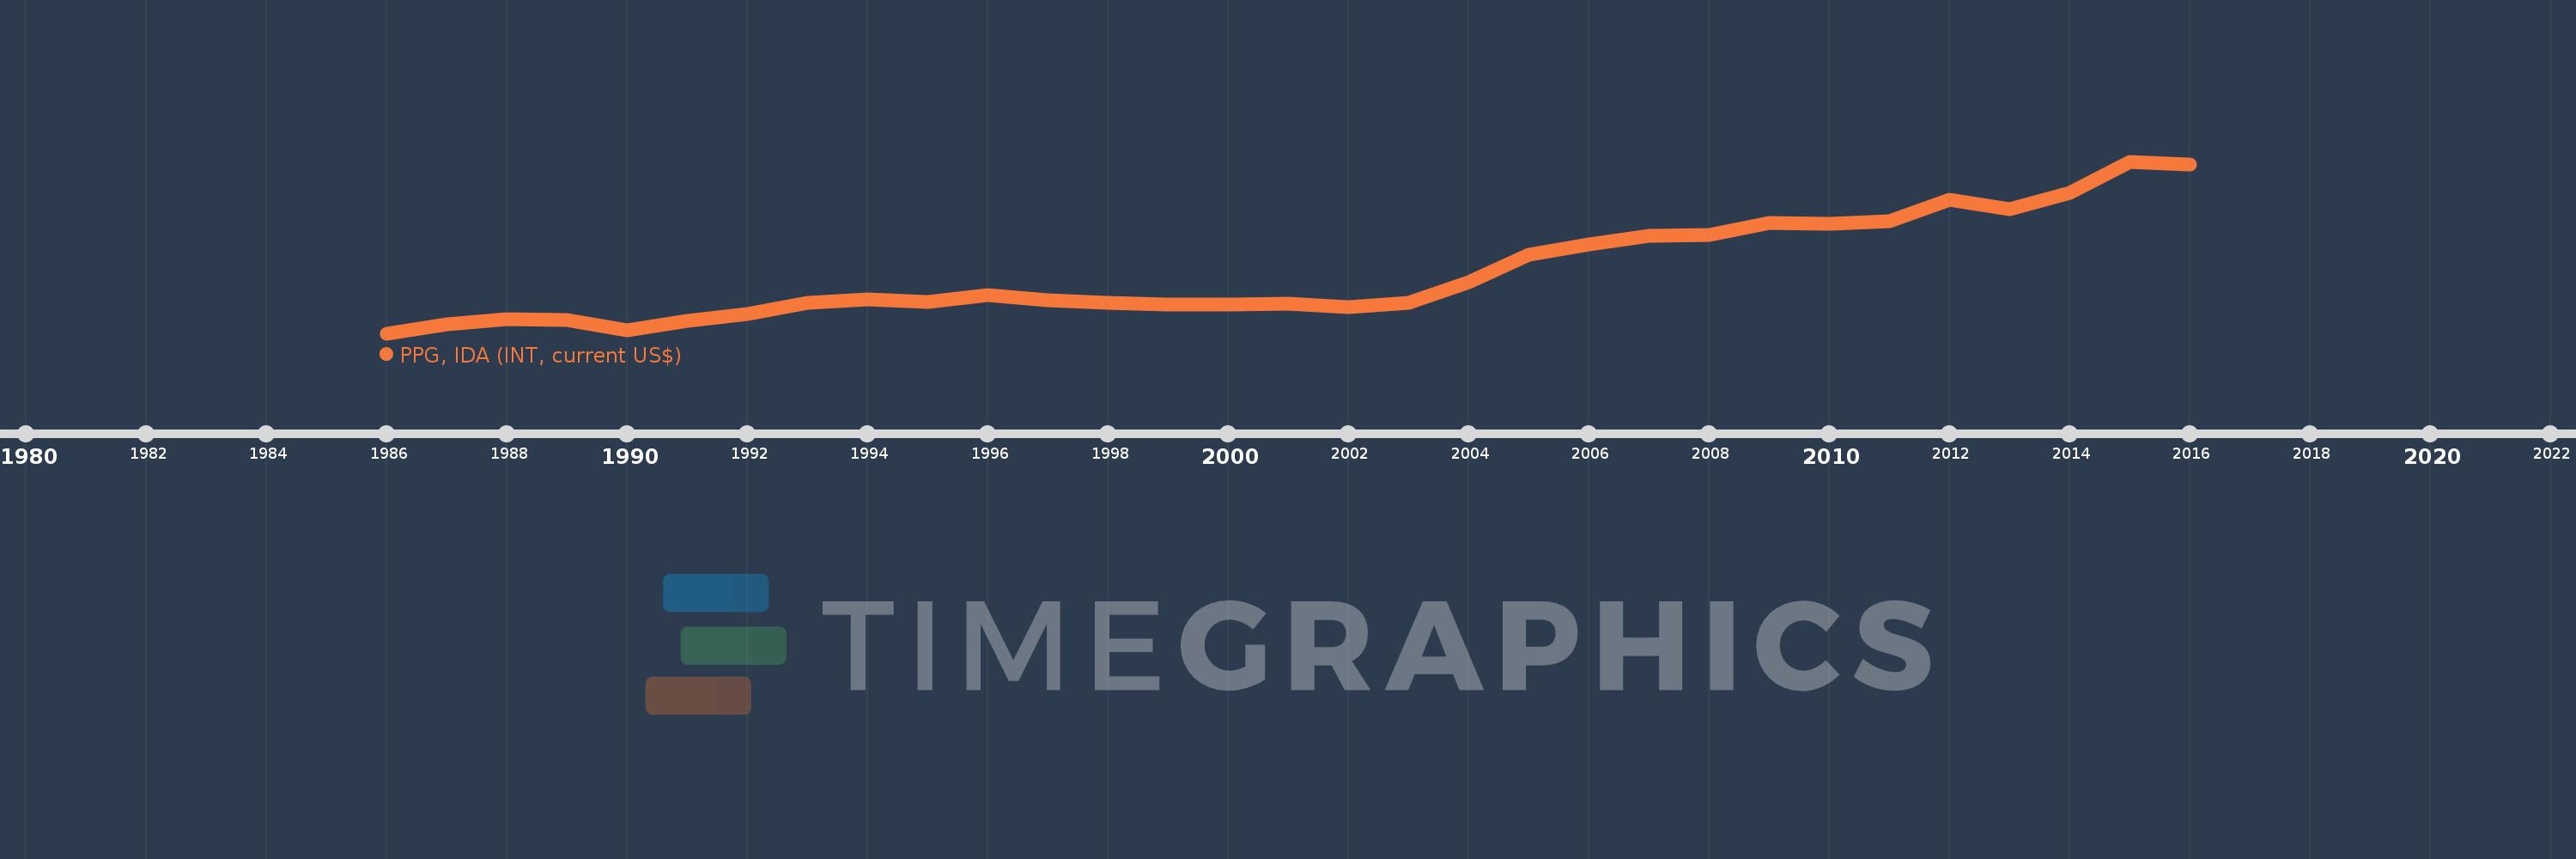
PPG, IDA (INT, current US$)
2016,2015,2014,2013,2012,2011,2010,2009,2008,2007,2006,2005,2004,2003,2002,2001,2000,1999,1998,1997,1996,1995,1994,1993,1992,1991,1990,1989,1988,1987,1986
Estas estadísticas en otros países:
línea de tiempo (timeline):
En esta escala de tiempo se presenta un gráfico de 1986 y 2016 de St. Vincent and the Grenadines. Los datos de 1985 están ausentes. El número de observaciones reales por fecha: 31.
Fuente (nombre):
Indicadores del desarrollo mundial
Fuente (organización):
World Bank, International Debt Statistics.
Categorías:
External Debt
Se ha actualizado:
23 abr 2017 año
Los indicadores de los cambios de valor en los últimos años
Mínimo:
22.0 mil
1 ene 1986 año
Máximo:
214.0 mil
1 ene 2015 año
A la fecha de observación
Valor
Cambio absoluto
El cambio con respecto al valor anterior
1 ene 1986 año
22.0 mil
+22.0 mil
0.0%
1 ene 1987 año
32.0 mil
+10.0 mil
45.45%
1 ene 1988 año
38.0 mil
+6.0 mil
18.75%
1 ene 1989 año
37.0 mil
-1000.0
-2.63%
1 ene 1990 año
25.0 mil
-12.0 mil
-32.43%
1 ene 1991 año
36.0 mil
+11.0 mil
44.0%
1 ene 1992 año
44.0 mil
+8.0 mil
22.22%
1 ene 1993 año
56.0 mil
+12.0 mil
27.27%
1 ene 1994 año
60.0 mil
+4.0 mil
7.14%
1 ene 1995 año
57.0 mil
-3.0 mil
-5.0%
1 ene 1996 año
65.0 mil
+8.0 mil
14.04%
1 ene 1997 año
59.0 mil
-6.0 mil
-9.23%
1 ene 1998 año
56.0 mil
-3.0 mil
-5.08%
1 ene 1999 año
54.0 mil
-2.0 mil
-3.57%
1 ene 2000 año
54.0 mil
0.0
0.0%
1 ene 2001 año
55.0 mil
+1000.0
1.85%
1 ene 2002 año
51.0 mil
-4.0 mil
-7.27%
1 ene 2003 año
56.0 mil
+5.0 mil
9.8%
1 ene 2004 año
79.0 mil
+23.0 mil
41.07%
1 ene 2005 año
110.0 mil
+31.0 mil
39.24%
1 ene 2006 año
121.0 mil
+11.0 mil
10.0%
1 ene 2007 año
131.0 mil
+10.0 mil
8.26%
1 ene 2008 año
132.0 mil
+1000.0
0.76%
1 ene 2009 año
145.0 mil
+13.0 mil
9.85%
1 ene 2010 año
144.0 mil
-1000.0
-0.69%
1 ene 2011 año
147.0 mil
+3.0 mil
2.08%
1 ene 2012 año
171.0 mil
+24.0 mil
16.33%
1 ene 2013 año
161.0 mil
-10.0 mil
-5.85%
1 ene 2014 año
179.0 mil
+18.0 mil
11.18%
1 ene 2015 año
214.0 mil
+35.0 mil
19.55%
1 ene 2016 año
211.0 mil
-3.0 mil
-1.4%
Ranking de los países por los datos estadísticos actuales


Comentarios: