29
/es/
es
AIzaSyAYiBZKx7MnpbEhh9jyipgxe19OcubqV5w
April 1, 2024
251075
St. Lucia
LCA
true
2
1
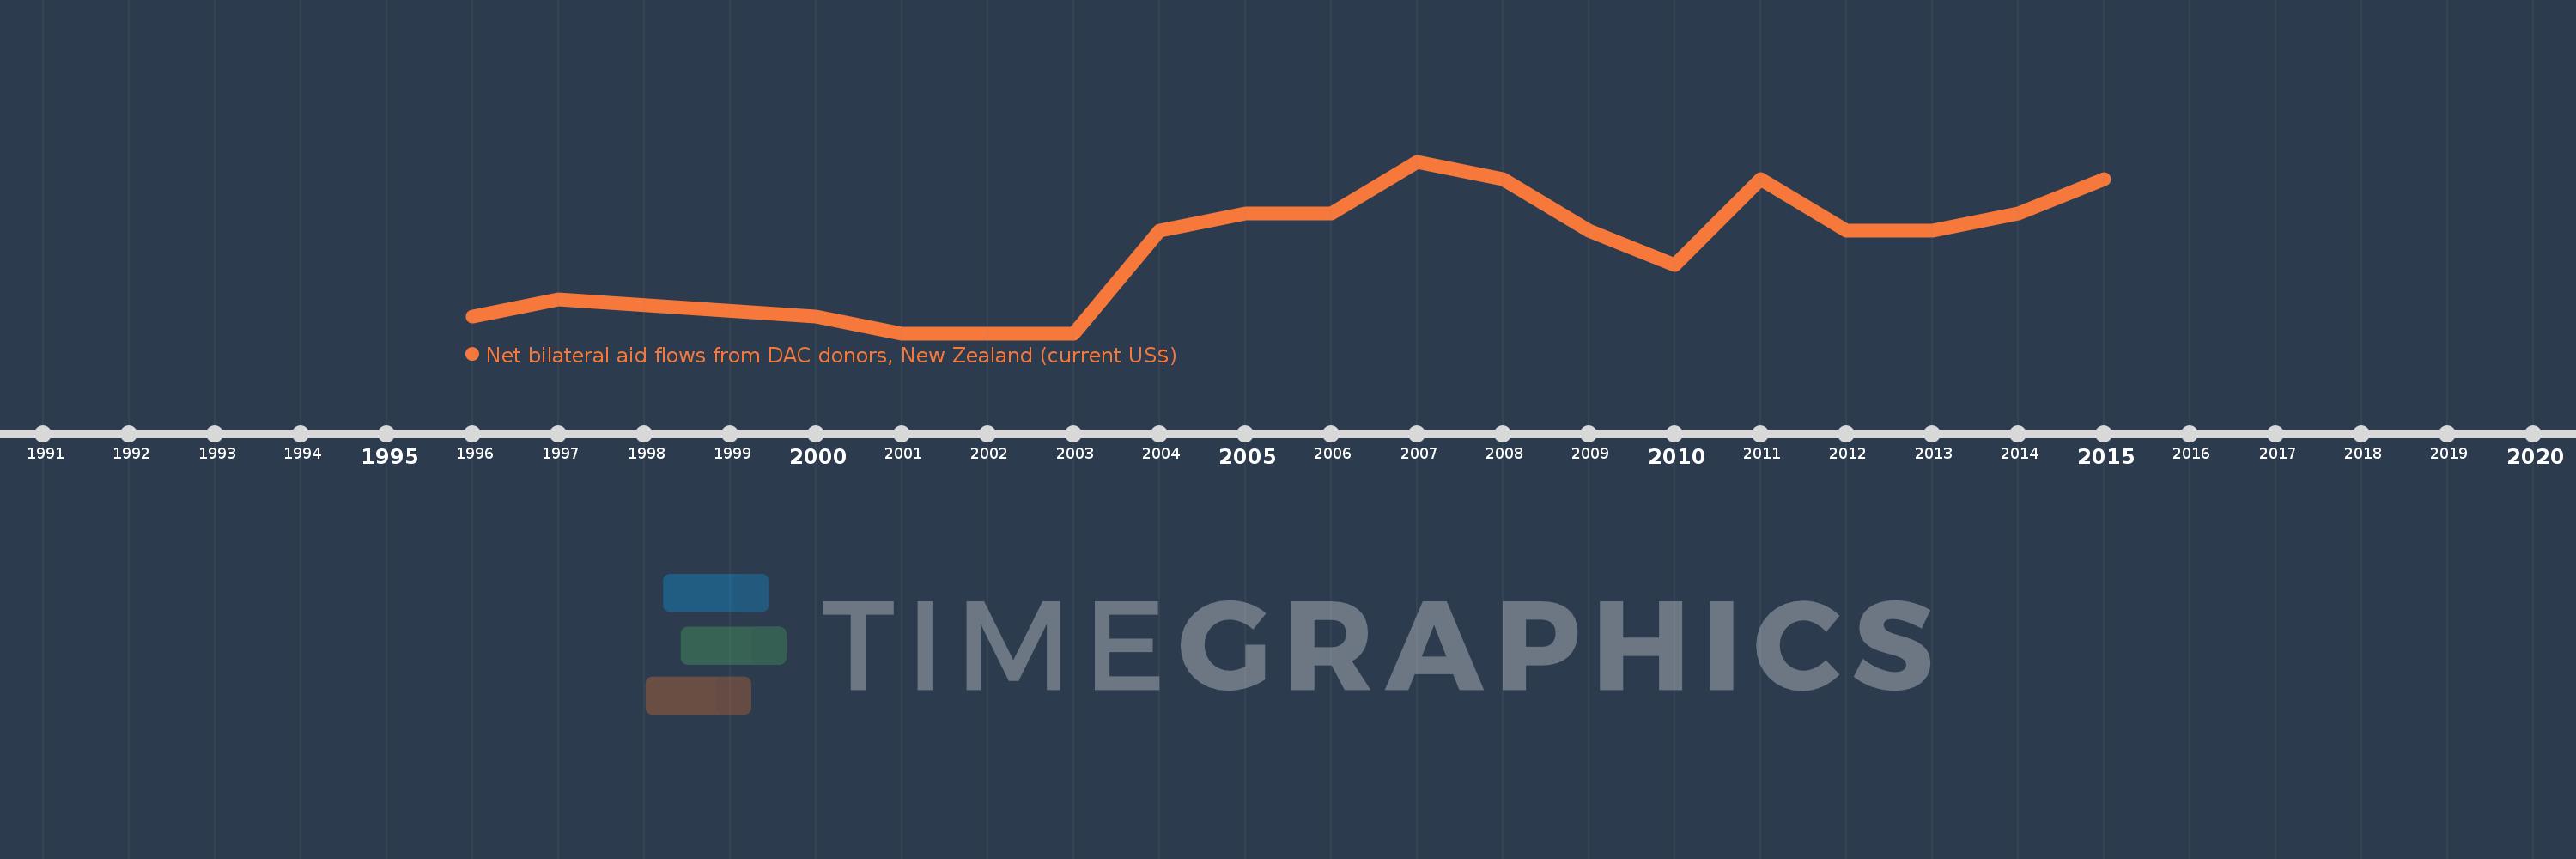
Net bilateral aid flows from DAC donors, New Zealand (current US$)
2015,2014,2013,2012,2011,2010,2009,2008,2007,2006,2005,2004,2003,2001,2000,1997,1996
Estas estadísticas en otros países:
AfghanistanAlgeriaAngolaAntigua and BarbudaArab WorldArgentinaBahamas, TheBangladeshBarbadosBelizeBeninBhutanBoliviaBosnia and HerzegovinaBotswanaBrazilBrunei DarussalamBurkina FasoBurundiCambodiaCameroonCaribbean small statesCentral African RepublicCentral Europe and the BalticsChadChileChinaColombiaComorosCongo, Dem. Rep.Costa RicaCote d'IvoireCyprusCzech RepublicDjiboutiDominicaEast Asia & PacificEast Asia & Pacific (excluding high income)East Asia & Pacific (IDA & IBRD countries)EcuadorEgypt, Arab Rep.El SalvadorEritreaEthiopiaEuro areaEurope & Central AsiaEurope & Central Asia (excluding high income)Europe & Central Asia (IDA & IBRD countries)European UnionFijiFragile and conflict affected situationsFrench PolynesiaGambia, TheGhanaGrenadaGuatemalaGuinea-BissauGuyanaHaitiHeavily indebted poor countries (HIPC)High incomeHondurasHong Kong SAR, ChinaHungaryIBRD onlyIDA & IBRD totalIDA blendIDA onlyIDA totalIndiaIndonesiaIran, Islamic Rep.IraqIsraelJamaicaJordanKazakhstanKenyaKiribatiKorea, Dem. People’s Rep.Korea, Rep.KuwaitKyrgyz RepublicLao PDRLatin America & Caribbean Latin America & Caribbean (excluding high income)Latin America & the Caribbean (IDA & IBRD countries)Least developed countries: UN classificationLebanonLesothoLiberiaLibyaLow & middle incomeLow incomeLower middle incomeMadagascarMalawiMalaysiaMaldivesMaliMaltaMarshall IslandsMauritaniaMauritiusMexicoMicronesia, Fed. Sts.Middle East & North AfricaMiddle East & North Africa (excluding high income)Middle East & North Africa (IDA & IBRD countries)Middle incomeMongoliaMoroccoMozambiqueMyanmarNamibiaNauruNepalNew CaledoniaNicaraguaNigerNigeriaNorthern Mariana IslandsOECD membersOther small statesPacific island small statesPakistanPalauPapua New GuineaParaguayPeruPhilippinesRussian FederationRwandaSamoaSenegalSerbiaSeychellesSierra LeoneSingaporeSlovak RepublicSmall statesSolomon IslandsSomaliaSouth AfricaSouth AsiaSouth Asia (IDA & IBRD)South SudanSri LankaSt. LuciaSt. Vincent and the GrenadinesSub-Saharan Africa Sub-Saharan Africa (excluding high income)Sub-Saharan Africa (IDA & IBRD countries)SudanSurinameSwazilandSyrian Arab RepublicTajikistanTanzaniaThailandTimor-LesteTongaTrinidad and TobagoTunisiaTurkeyTurkmenistanTuvaluUgandaUpper middle incomeUruguayUzbekistanVanuatuVenezuela, RBVietnamWest Bank and GazaWorldYemen, Rep.ZambiaZimbabwe línea de tiempo (timeline):
En esta escala de tiempo se presenta un gráfico de 1996 y 2015 de St. Lucia. Los datos de 1995 están ausentes. El número de observaciones reales por fecha: 17.
Fuente (nombre):
Indicadores del desarrollo mundial
Fuente (organización):
Development Assistance Committee of the Organisation for Economic Co-operation and Development, Geographical Distribution of Financial Flows to Developing Countries, Development Co-operation Report, and International Development Statistics database. Data are available online at: www.oecd.org/dac/stats/idsonline.
Categorías:
Aid Effectiveness
Se ha actualizado:
23 abr 2017 año
Los indicadores de los cambios de valor en los últimos años
Mínimo:
10.0 mil
1 ene 2001 año
Máximo:
110.0 mil
1 ene 2007 año
A la fecha de observación
Valor
Cambio absoluto
El cambio con respecto al valor anterior
1 ene 1996 año
20.0 mil
+20.0 mil
0.0%
1 ene 1997 año
30.0 mil
+10.0 mil
50.0%
1 ene 2000 año
20.0 mil
-10.0 mil
-33.33%
1 ene 2001 año
10.0 mil
-10.0 mil
-50.0%
1 ene 2003 año
10.0 mil
0.0
0.0%
1 ene 2004 año
70.0 mil
+60.0 mil
600.0%
1 ene 2005 año
80.0 mil
+10.0 mil
14.29%
1 ene 2006 año
80.0 mil
0.0
0.0%
1 ene 2007 año
110.0 mil
+30.0 mil
37.5%
1 ene 2008 año
100.0 mil
-10.0 mil
-9.09%
1 ene 2009 año
70.0 mil
-30.0 mil
-30.0%
1 ene 2010 año
50.0 mil
-20.0 mil
-28.57%
1 ene 2011 año
100.0 mil
+50.0 mil
100.0%
1 ene 2012 año
70.0 mil
-30.0 mil
-30.0%
1 ene 2013 año
70.0 mil
0.0
0.0%
1 ene 2014 año
80.0 mil
+10.0 mil
14.29%
1 ene 2015 año
100.0 mil
+20.0 mil
25.0%
Ranking de los países por los datos estadísticos actuales


Comentarios: