29
/es/
es
AIzaSyAYiBZKx7MnpbEhh9jyipgxe19OcubqV5w
April 1, 2024
247583
Spain
ESP
true
2
1
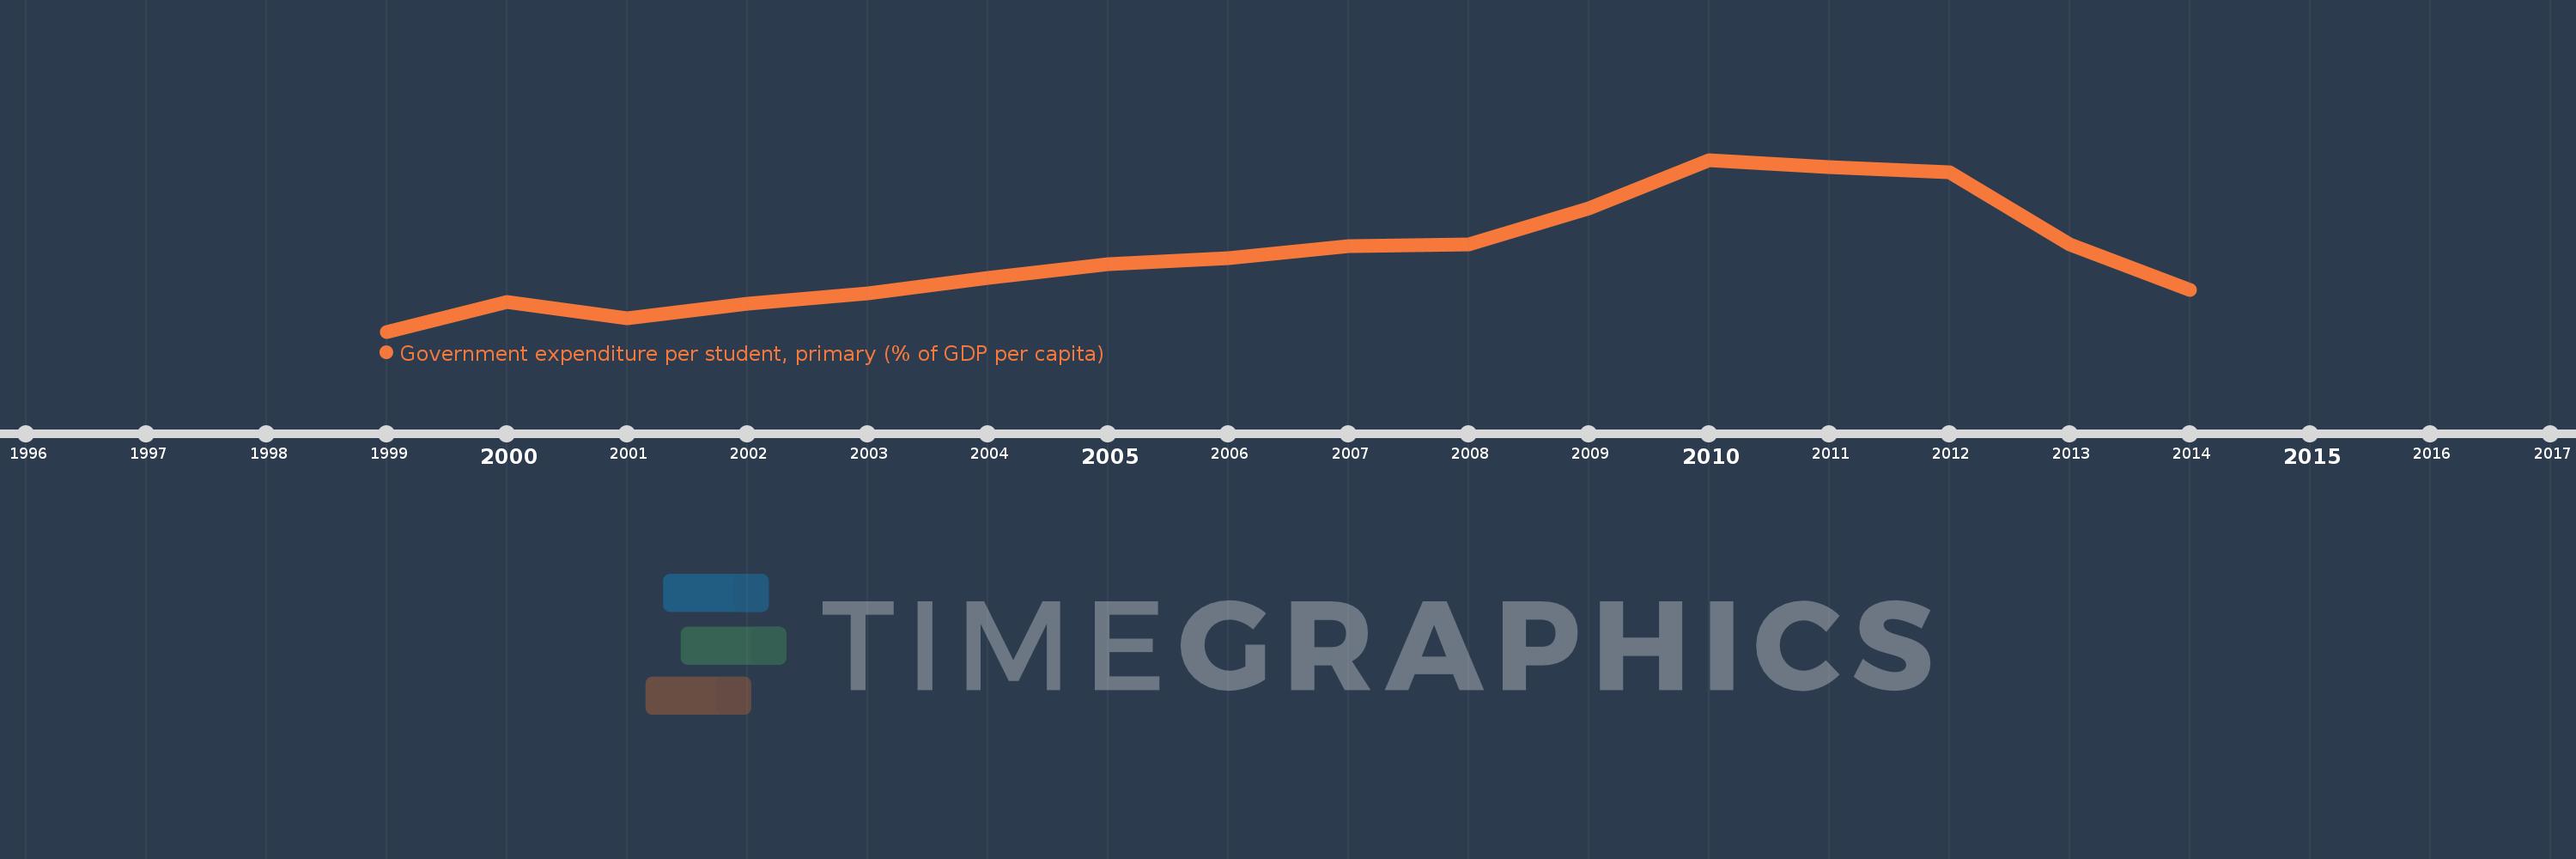
Government expenditure per student, primary (% of GDP per capita)
2014,2013,2012,2011,2010,2009,2008,2007,2006,2005,2004,2003,2002,2001,2000,1999
Estas estadísticas en otros países:
línea de tiempo (timeline):
En esta escala de tiempo se presenta un gráfico de 1999 y 2014 de Spain. Los datos de 1998 están ausentes. El número de observaciones reales por fecha: 16.
Fuente (nombre):
Indicadores del desarrollo mundial
Fuente (organización):
United Nations Educational, Scientific, and Cultural Organization (UNESCO) Institute for Statistics.
Categorías:
Education
Se ha actualizado:
23 abr 2017 año
Los indicadores de los cambios de valor en los últimos años
Mínimo:
16.758
1 ene 1999 año
Máximo:
21.276
1 ene 2010 año
A la fecha de observación
Valor
Cambio absoluto
El cambio con respecto al valor anterior
1 ene 1999 año
16.758
+16.758
0.0%
1 ene 2000 año
17.53
+0.772
4.61%
1 ene 2001 año
17.098
-0.433
-2.47%
1 ene 2002 año
17.486
+0.389
2.27%
1 ene 2003 año
17.763
+0.276
1.58%
1 ene 2004 año
18.169
+0.406
2.29%
1 ene 2005 año
18.524
+0.354
1.95%
1 ene 2006 año
18.7
+0.177
0.95%
1 ene 2007 año
19.017
+0.317
1.69%
1 ene 2008 año
19.041
+0.023
0.12%
1 ene 2009 año
20.002
+0.961
5.05%
1 ene 2010 año
21.276
+1.275
6.37%
1 ene 2011 año
21.073
-0.204
-0.96%
1 ene 2012 año
20.955
-0.117
-0.56%
1 ene 2013 año
19.042
-1.914
-9.13%
1 ene 2014 año
17.863
-1.178
-6.19%
Ranking de los países por los datos estadísticos actuales


Comentarios: