29
/es/
es
AIzaSyAYiBZKx7MnpbEhh9jyipgxe19OcubqV5w
April 1, 2024
247455
Spain
ESP
true
2
1
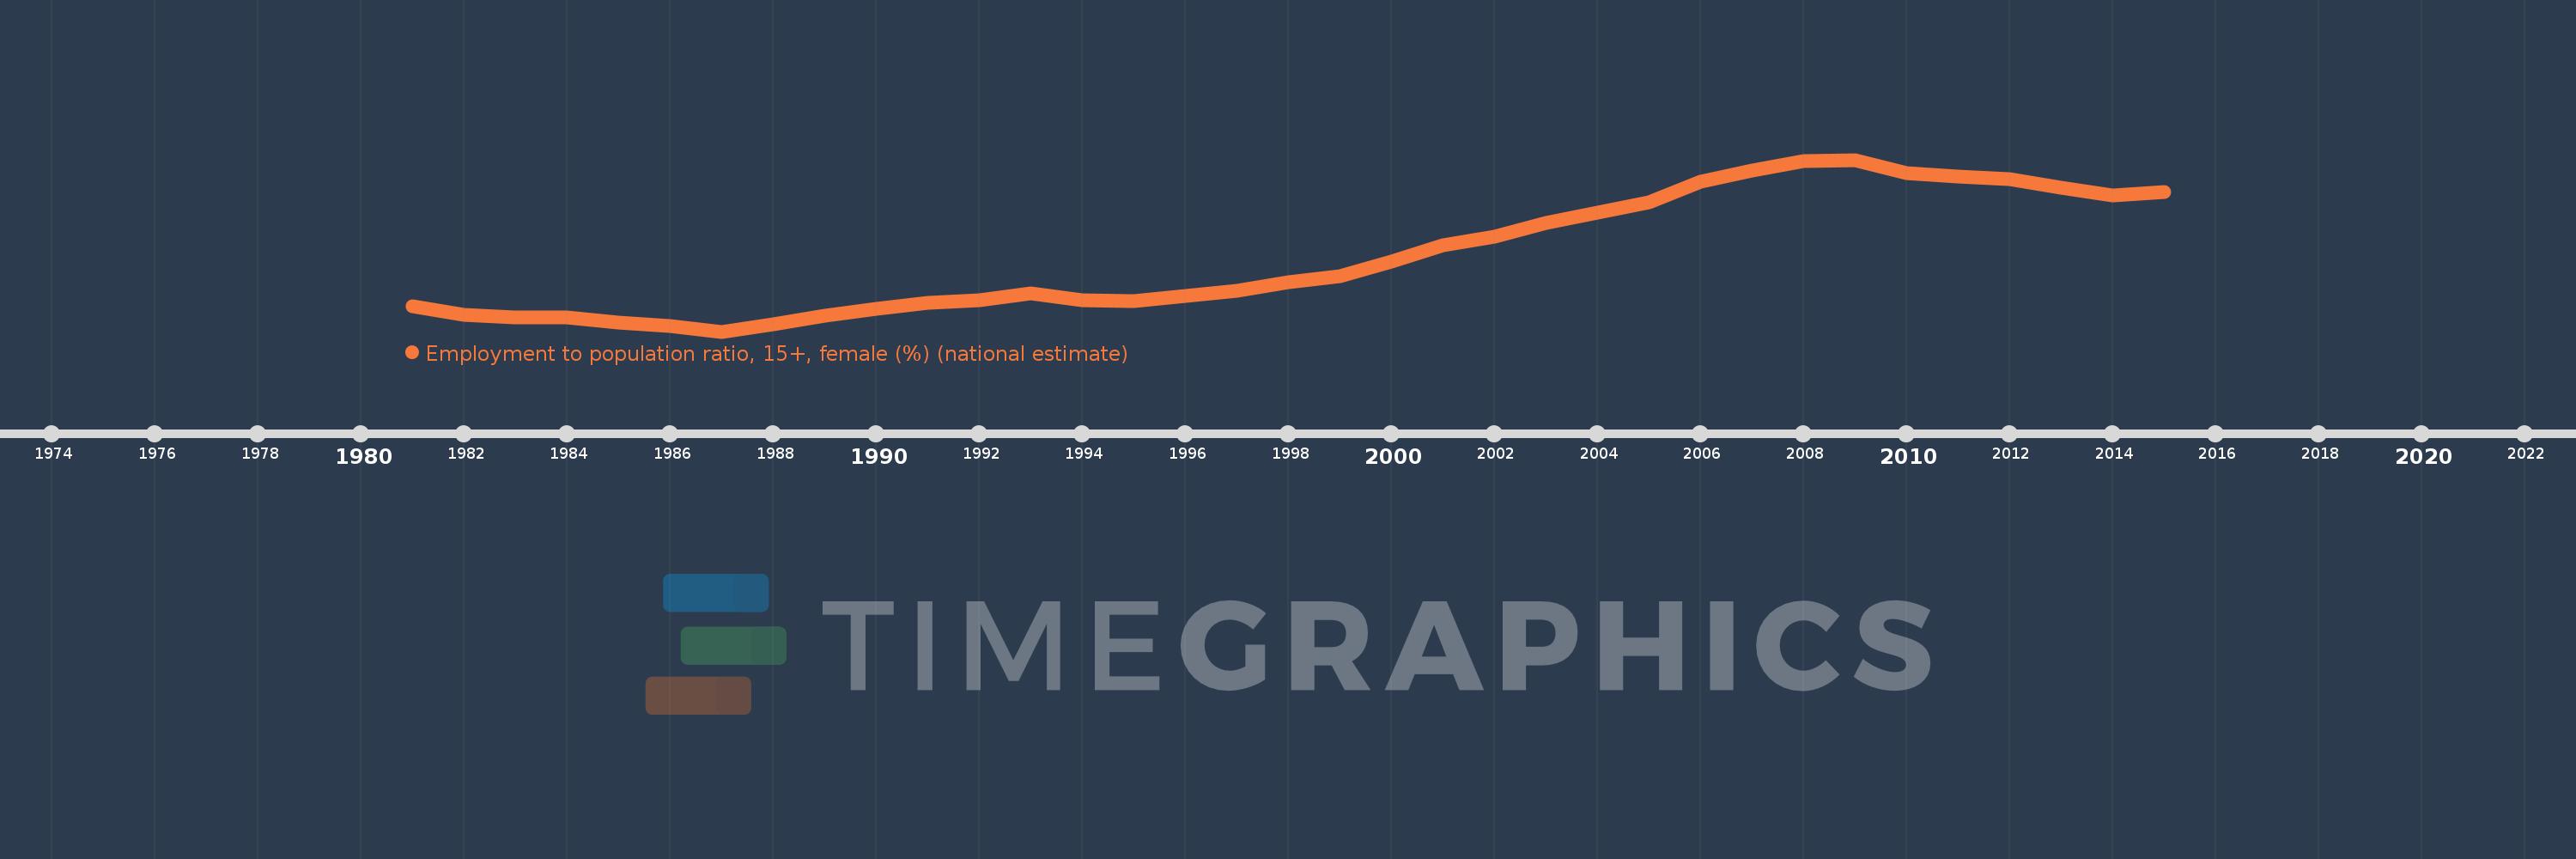
Employment to population ratio, 15+, female (%) (national estimate)
2015,2014,2013,2012,2011,2010,2009,2008,2007,2006,2005,2004,2003,2002,2001,2000,1999,1998,1997,1996,1995,1994,1993,1992,1991,1990,1989,1988,1987,1986,1985,1984,1983,1982,1981
Estas estadísticas en otros países:
AfghanistanAlbaniaAlgeriaAmerican SamoaAntigua and BarbudaArab WorldArgentinaArmeniaArubaAustraliaAustriaAzerbaijanBahamas, TheBahrainBangladeshBarbadosBelarusBelgiumBelizeBeninBermudaBhutanBoliviaBosnia and HerzegovinaBotswanaBrazilBritish Virgin IslandsBrunei DarussalamBulgariaBurkina FasoBurundiCambodiaCameroonCanadaCaribbean small statesCayman IslandsCentral Europe and the BalticsChadChileColombiaCongo, Dem. Rep.Congo, Rep.Costa RicaCroatiaCubaCyprusCzech RepublicDenmarkDjiboutiDominicaDominican RepublicEarly-demographic dividendEcuadorEgypt, Arab Rep.El SalvadorEstoniaEthiopiaEuro areaEurope & Central AsiaEurope & Central Asia (excluding high income)Europe & Central Asia (IDA & IBRD countries)European UnionFaroe IslandsFijiFinlandFranceFrench PolynesiaGabonGambia, TheGeorgiaGermanyGhanaGreeceGrenadaGuamGuatemalaGuineaGuyanaHaitiHigh incomeHondurasHong Kong SAR, ChinaHungaryIcelandIndiaIndonesiaIran, Islamic Rep.IraqIrelandIsle of ManIsraelItalyJamaicaJapanJordanKazakhstanKenyaKiribatiKorea, Rep.KosovoKuwaitKyrgyz RepublicLao PDRLatin America & Caribbean Latin America & Caribbean (excluding high income)Latin America & the Caribbean (IDA & IBRD countries)LatviaLebanonLesothoLiberiaLibyaLithuaniaLower middle incomeLuxembourgMacao SAR, ChinaMacedonia, FYRMadagascarMalawiMalaysiaMaldivesMaliMaltaMarshall IslandsMauritaniaMauritiusMexicoMiddle East & North AfricaMiddle East & North Africa (excluding high income)Middle East & North Africa (IDA & IBRD countries)MoldovaMonacoMongoliaMontenegroMoroccoMozambiqueNamibiaNepalNetherlandsNew CaledoniaNew ZealandNicaraguaNigerNigeriaNorth AmericaNorthern Mariana IslandsNorwayOECD membersOmanPakistanPanamaParaguayPeruPhilippinesPolandPortugalPost-demographic dividendPuerto RicoQatarRomaniaRussian FederationRwandaSamoaSan MarinoSao Tome and PrincipeSaudi ArabiaSenegalSerbiaSeychellesSierra LeoneSingaporeSlovak RepublicSloveniaSolomon IslandsSouth AfricaSouth AsiaSouth Asia (IDA & IBRD)South SudanSpainSri LankaSt. Kitts and NevisSt. LuciaSudanSurinameSwazilandSwedenSwitzerlandSyrian Arab RepublicTajikistanTanzaniaThailandTimor-LesteTogoTongaTrinidad and TobagoTunisiaTurkeyTuvaluUgandaUkraineUnited Arab EmiratesUnited KingdomUnited StatesUruguayVanuatuVenezuela, RBVietnamWest Bank and GazaYemen, Rep.ZambiaZimbabwe línea de tiempo (timeline):
En esta escala de tiempo se presenta un gráfico de 1981 y 2015 de Spain. Los datos de 1980 están ausentes. El número de observaciones reales por fecha: 35.
Fuente (nombre):
Indicadores del desarrollo mundial
Fuente (organización):
International Labour Organization, Key Indicators of the Labour Market database.
Categorías:
Social Protection & Labor
Se ha actualizado:
23 abr 2017 año
Los indicadores de los cambios de valor en los últimos años
Mínimo:
20.8
1 ene 1987 año
Máximo:
43.9
1 ene 2009 año
A la fecha de observación
Valor
Cambio absoluto
El cambio con respecto al valor anterior
1 ene 1981 año
24.2
+24.2
0.0%
1 ene 1982 año
23.0
-1.2
-4.96%
1 ene 1983 año
22.7
-0.3
-1.3%
1 ene 1984 año
22.7
0.0
0.0%
1 ene 1985 año
22.0
-0.7
-3.08%
1 ene 1986 año
21.5
-0.5
-2.27%
1 ene 1987 año
20.8
-0.7
-3.26%
1 ene 1988 año
21.8
+1.0
4.81%
1 ene 1989 año
22.9
+1.1
5.05%
1 ene 1990 año
23.9
+1.0
4.37%
1 ene 1991 año
24.7
+0.8
3.35%
1 ene 1992 año
25.0
+0.3
1.21%
1 ene 1993 año
25.9
+0.9
3.6%
1 ene 1994 año
25.0
-0.9
-3.47%
1 ene 1995 año
24.9
-0.1
-0.4%
1 ene 1996 año
25.6
+0.7
2.81%
1 ene 1997 año
26.3
+0.7
2.73%
1 ene 1998 año
27.4
+1.1
4.18%
1 ene 1999 año
28.2
+0.8
2.92%
1 ene 2000 año
30.2
+2.0
7.09%
1 ene 2001 año
32.4
+2.2
7.28%
1 ene 2002 año
33.6
+1.2
3.7%
1 ene 2003 año
35.4
+1.8
5.36%
1 ene 2004 año
36.8
+1.4
3.95%
1 ene 2005 año
38.2
+1.4
3.8%
1 ene 2006 año
40.9
+2.7
7.07%
1 ene 2007 año
42.5
+1.6
3.91%
1 ene 2008 año
43.7
+1.2
2.82%
1 ene 2009 año
43.9
+0.2
0.46%
1 ene 2010 año
42.1
-1.8
-4.1%
1 ene 2011 año
41.6
-0.5
-1.19%
1 ene 2012 año
41.3
-0.3
-0.72%
1 ene 2013 año
40.1
-1.2
-2.91%
1 ene 2014 año
39.1
-1.0
-2.49%
1 ene 2015 año
39.6
+0.5
1.28%
Ranking de los países por los datos estadísticos actuales


Comentarios: