29
/es/
es
AIzaSyAYiBZKx7MnpbEhh9jyipgxe19OcubqV5w
April 1, 2024
245255
South Africa
ZAF
true
2
1
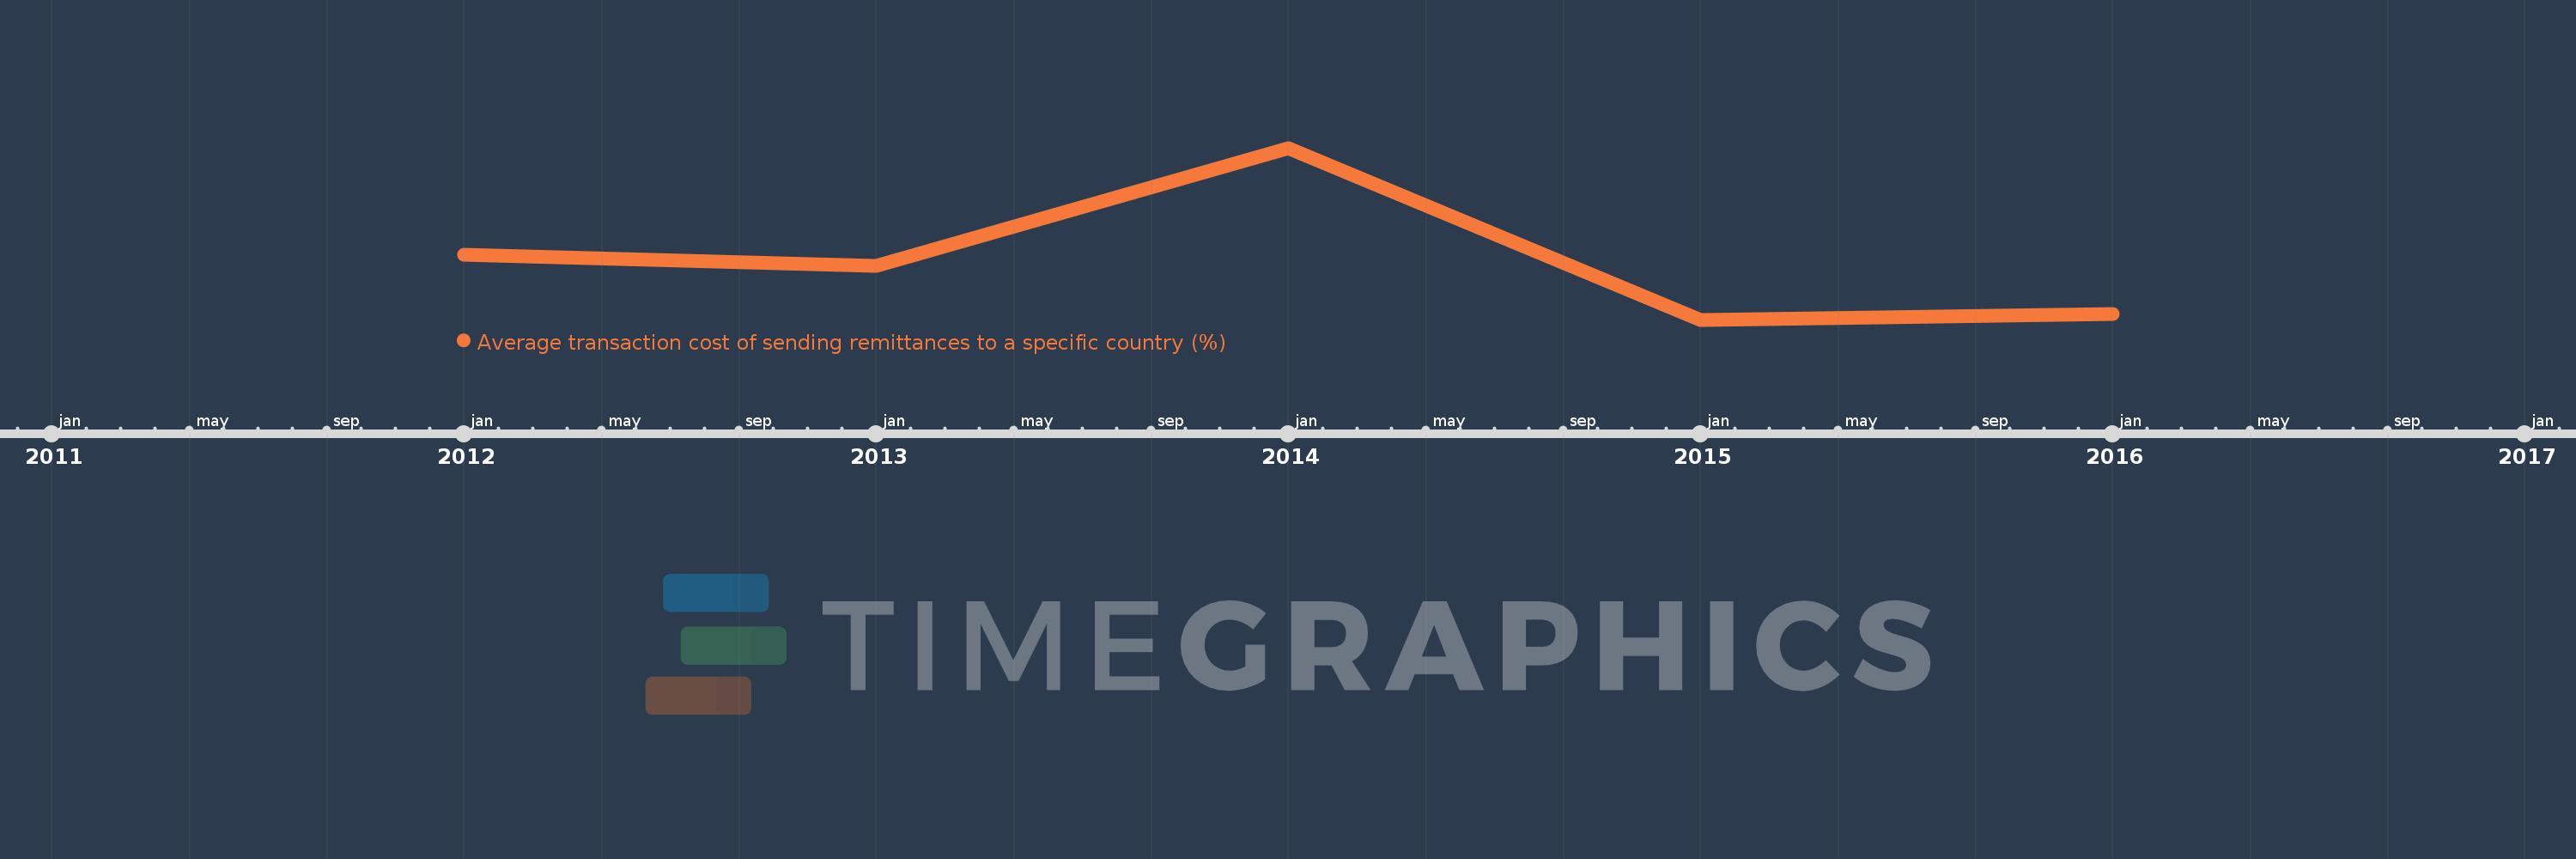
Average transaction cost of sending remittances to a specific country (%)
2016,2015,2014,2013,2012
Estas estadísticas en otros países:
línea de tiempo (timeline):
En esta escala de tiempo se presenta un gráfico de 2012 y 2016 de South Africa. Los datos de 2011 están ausentes. El número de observaciones reales por fecha: 5.
Fuente (nombre):
Indicadores del desarrollo mundial
Fuente (organización):
World Bank, Remittance Prices Worldwide, available at http://remittanceprices.worldbank.org
Categorías:
Financial Sector
Se ha actualizado:
23 abr 2017 año
Los indicadores de los cambios de valor en los últimos años
Mínimo:
8.395
1 ene 2015 año
Máximo:
9.476
1 ene 2014 año
A la fecha de observación
Valor
Cambio absoluto
El cambio con respecto al valor anterior
1 ene 2012 año
8.805
+8.805
0.0%
1 ene 2013 año
8.733
-0.072
-0.82%
1 ene 2014 año
9.476
+0.743
8.5%
1 ene 2015 año
8.395
-1.081
-11.4%
1 ene 2016 año
8.433
+0.038
0.45%
Ranking de los países por los datos estadísticos actuales


Comentarios: