29
/es/
es
AIzaSyAYiBZKx7MnpbEhh9jyipgxe19OcubqV5w
April 1, 2024
24312
Arab World
ARB
false
2
1
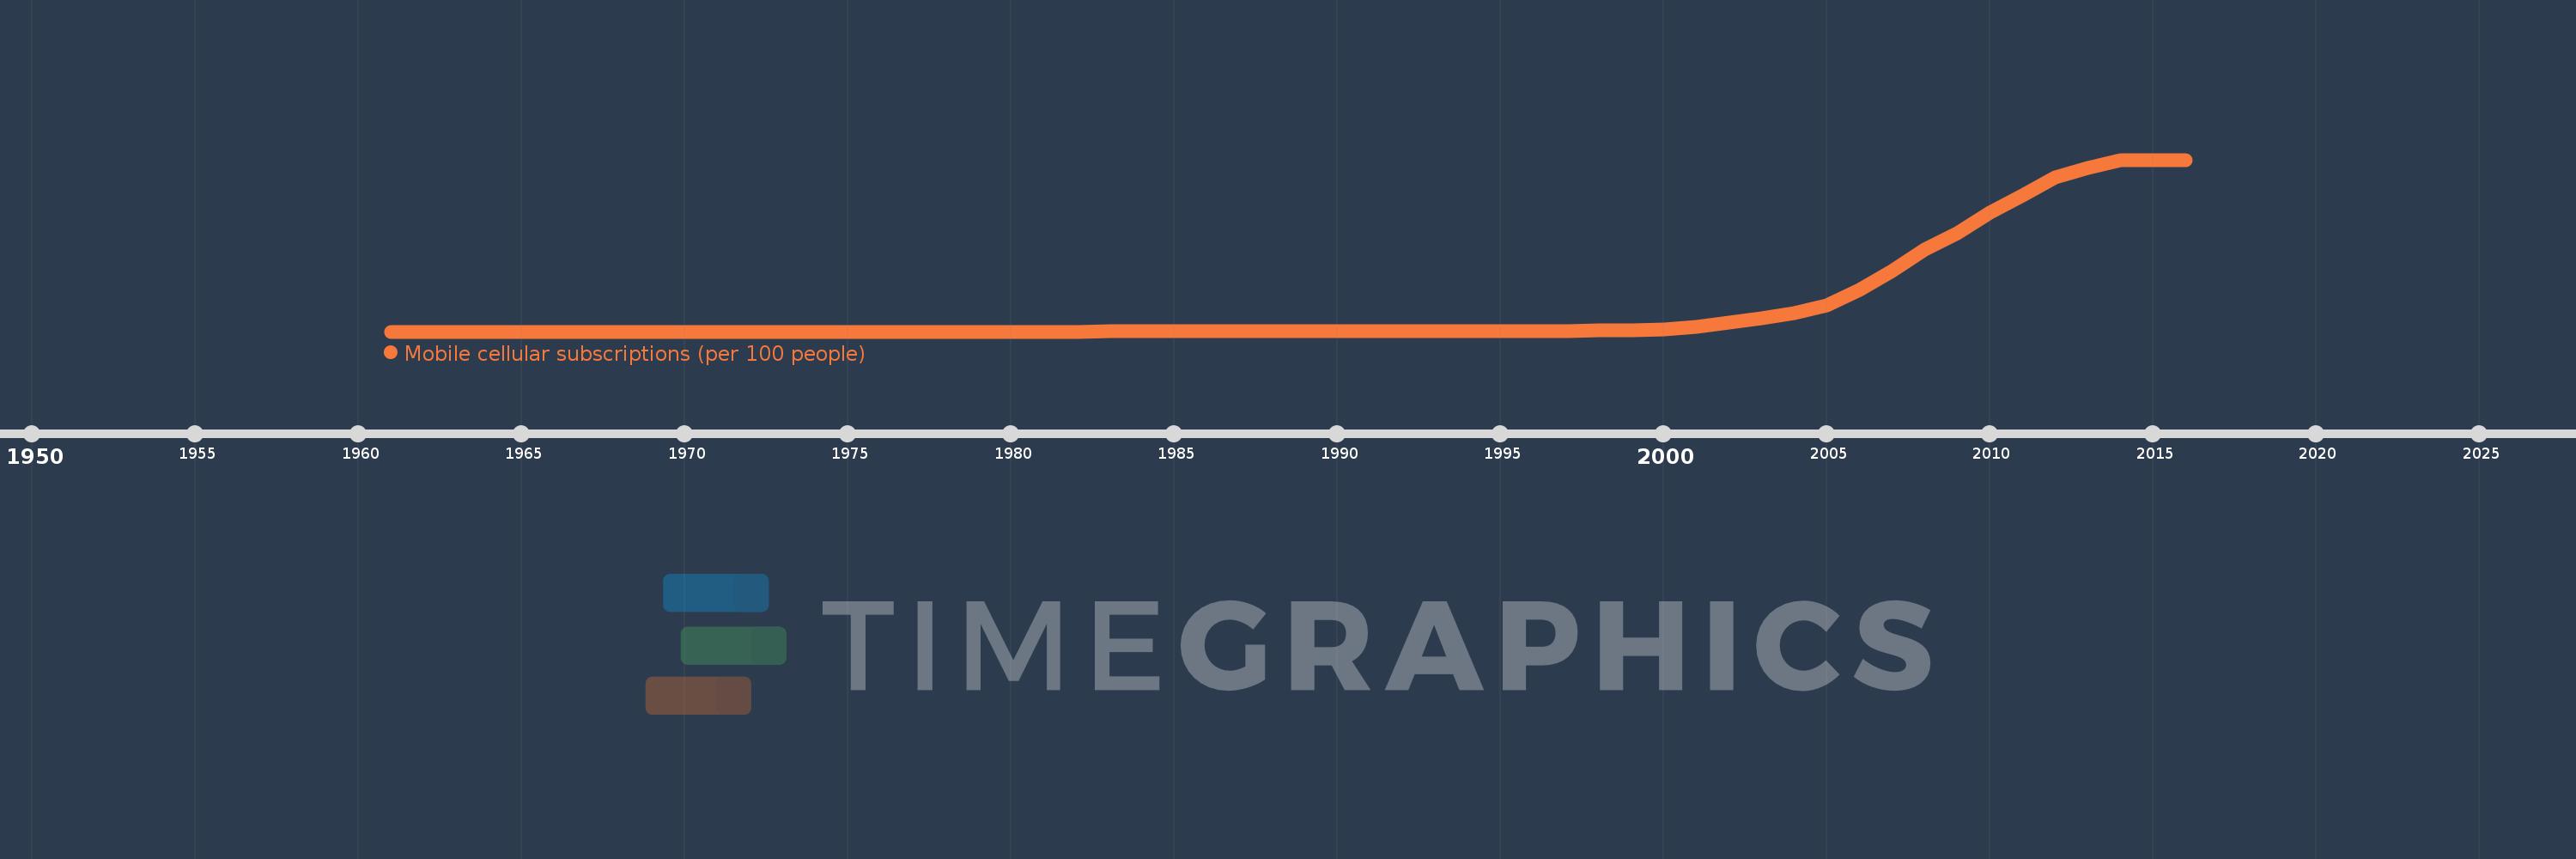
Mobile cellular subscriptions (per 100 people)
2016,2015,2014,2013,2012,2011,2010,2009,2008,2007,2006,2005,2004,2003,2002,2001,2000,1999,1998,1997,1996,1995,1994,1993,1992,1991,1990,1989,1988,1987,1986,1985,1984,1983,1982,1981,1980,1979,1978,1977,1976,1971,1966,1961
Estas estadísticas en otros países:
AfghanistanAlbaniaAlgeriaAmerican SamoaAndorraAngolaAntigua and BarbudaArab WorldArgentinaArmeniaArubaAustraliaAustriaAzerbaijanBahamas, TheBahrainBangladeshBarbadosBelarusBelgiumBelizeBeninBermudaBhutanBoliviaBosnia and HerzegovinaBotswanaBrazilBritish Virgin IslandsBrunei DarussalamBulgariaBurkina FasoBurundiCabo VerdeCambodiaCameroonCanadaCaribbean small statesCayman IslandsCentral African RepublicCentral Europe and the BalticsChadChileChinaColombiaComorosCongo, Dem. Rep.Congo, Rep.Costa RicaCote d'IvoireCroatiaCubaCuracaoCyprusCzech RepublicDenmarkDjiboutiDominicaDominican RepublicEarly-demographic dividendEast Asia & PacificEast Asia & Pacific (excluding high income)East Asia & Pacific (IDA & IBRD countries)EcuadorEgypt, Arab Rep.El SalvadorEquatorial GuineaEritreaEstoniaEthiopiaEuro areaEurope & Central AsiaEurope & Central Asia (excluding high income)Europe & Central Asia (IDA & IBRD countries)European UnionFaroe IslandsFijiFinlandFragile and conflict affected situationsFranceFrench PolynesiaGabonGambia, TheGeorgiaGermanyGhanaGibraltarGreeceGreenlandGrenadaGuamGuatemalaGuineaGuinea-BissauGuyanaHaitiHeavily indebted poor countries (HIPC)High incomeHondurasHong Kong SAR, ChinaHungaryIBRD onlyIcelandIDA & IBRD totalIDA blendIDA onlyIDA totalIndiaIndonesiaIran, Islamic Rep.IraqIrelandIsraelItalyJamaicaJapanJordanKazakhstanKenyaKiribatiKorea, Dem. People’s Rep.Korea, Rep.KosovoKuwaitKyrgyz RepublicLao PDRLate-demographic dividendLatin America & Caribbean Latin America & Caribbean (excluding high income)Latin America & the Caribbean (IDA & IBRD countries)LatviaLeast developed countries: UN classificationLebanonLesothoLiberiaLibyaLiechtensteinLithuaniaLow & middle incomeLow incomeLower middle incomeLuxembourgMacao SAR, ChinaMacedonia, FYRMadagascarMalawiMalaysiaMaldivesMaliMaltaMarshall IslandsMauritaniaMauritiusMexicoMicronesia, Fed. Sts.Middle East & North AfricaMiddle East & North Africa (excluding high income)Middle East & North Africa (IDA & IBRD countries)Middle incomeMoldovaMonacoMongoliaMontenegroMoroccoMozambiqueMyanmarNamibiaNauruNepalNetherlandsNew CaledoniaNew ZealandNicaraguaNigerNigeriaNorth AmericaNorthern Mariana IslandsNorwayOECD membersOmanOther small statesPacific island small statesPakistanPalauPanamaPapua New GuineaParaguayPeruPhilippinesPolandPortugalPost-demographic dividendPre-demographic dividendPuerto RicoQatarRomaniaRussian FederationRwandaSamoaSan MarinoSao Tome and PrincipeSaudi ArabiaSenegalSerbiaSeychellesSierra LeoneSingaporeSint Maarten (Dutch part)Slovak RepublicSloveniaSmall statesSolomon IslandsSomaliaSouth AfricaSouth AsiaSouth Asia (IDA & IBRD)South SudanSpainSri LankaSt. Kitts and NevisSt. LuciaSt. Vincent and the GrenadinesSub-Saharan Africa Sub-Saharan Africa (excluding high income)Sub-Saharan Africa (IDA & IBRD countries)SudanSurinameSwazilandSwedenSwitzerlandSyrian Arab RepublicTajikistanTanzaniaThailandTimor-LesteTogoTongaTrinidad and TobagoTunisiaTurkeyTurkmenistanTurks and Caicos IslandsTuvaluUgandaUkraineUnited Arab EmiratesUnited KingdomUnited StatesUpper middle incomeUruguayUzbekistanVanuatuVenezuela, RBVietnamVirgin Islands (U.S.)West Bank and GazaWorldYemen, Rep.ZambiaZimbabwe línea de tiempo (timeline):
En esta escala de tiempo se presenta un gráfico de 1961 y 2016 de Arab World. Los datos de 1960 están ausentes. El número de observaciones reales por fecha: 44.
Fuente (nombre):
Indicadores del desarrollo mundial
Fuente (organización):
International Telecommunication Union, World Telecommunication/ICT Development Report and database.
Categorías:
Infrastructure
Se ha actualizado:
23 abr 2017 año
Los indicadores de los cambios de valor en los últimos años
Máximo:
110.339
1 ene 2015 año
A la fecha de observación
Valor
Cambio absoluto
El cambio con respecto al valor anterior
1 ene 1961 año
0.0
0.0
0.0%
1 ene 1983 año
0.001
+0.001
%
1 ene 1984 año
0.002
+0.001
48.85%
1 ene 1985 año
0.003
+0.001
34.84%
1 ene 1986 año
0.004
+0.002
63.75%
1 ene 1987 año
0.011
+0.007
153.58%
1 ene 1988 año
0.017
+0.006
52.56%
1 ene 1989 año
0.02
+0.002
13.86%
1 ene 1990 año
0.029
+0.009
45.33%
1 ene 1991 año
0.039
+0.01
35.15%
1 ene 1992 año
0.056
+0.017
44.39%
1 ene 1993 año
0.064
+0.008
13.39%
1 ene 1994 año
0.081
+0.018
27.89%
1 ene 1995 año
0.105
+0.024
29.17%
1 ene 1996 año
0.198
+0.093
88.19%
1 ene 1997 año
0.355
+0.158
79.87%
1 ene 1998 año
0.611
+0.256
71.94%
1 ene 1999 año
0.935
+0.324
53.0%
1 ene 2000 año
1.491
+0.556
59.44%
1 ene 2001 año
3.178
+1.688
113.19%
1 ene 2002 año
5.747
+2.568
80.8%
1 ene 2003 año
8.527
+2.78
48.38%
1 ene 2004 año
11.596
+3.07
36.0%
1 ene 2005 año
16.838
+5.241
45.2%
1 ene 2006 año
26.79
+9.952
59.11%
1 ene 2007 año
38.846
+12.056
45.0%
1 ene 2008 año
52.537
+13.692
35.25%
1 ene 2009 año
62.921
+10.384
19.76%
1 ene 2010 año
76.156
+13.235
21.03%
1 ene 2011 año
87.629
+11.472
15.06%
1 ene 2012 año
98.873
+11.244
12.83%
1 ene 2013 año
105.037
+6.164
6.23%
1 ene 2014 año
110.013
+4.975
4.74%
1 ene 2015 año
110.339
+0.326
0.3%
1 ene 2016 año
110.113
-0.226
-0.2%
Ranking de los países por los datos estadísticos actuales


Comentarios: