29
/es/
es
AIzaSyAYiBZKx7MnpbEhh9jyipgxe19OcubqV5w
April 1, 2024
240511
Singapore
SGP
true
2
1
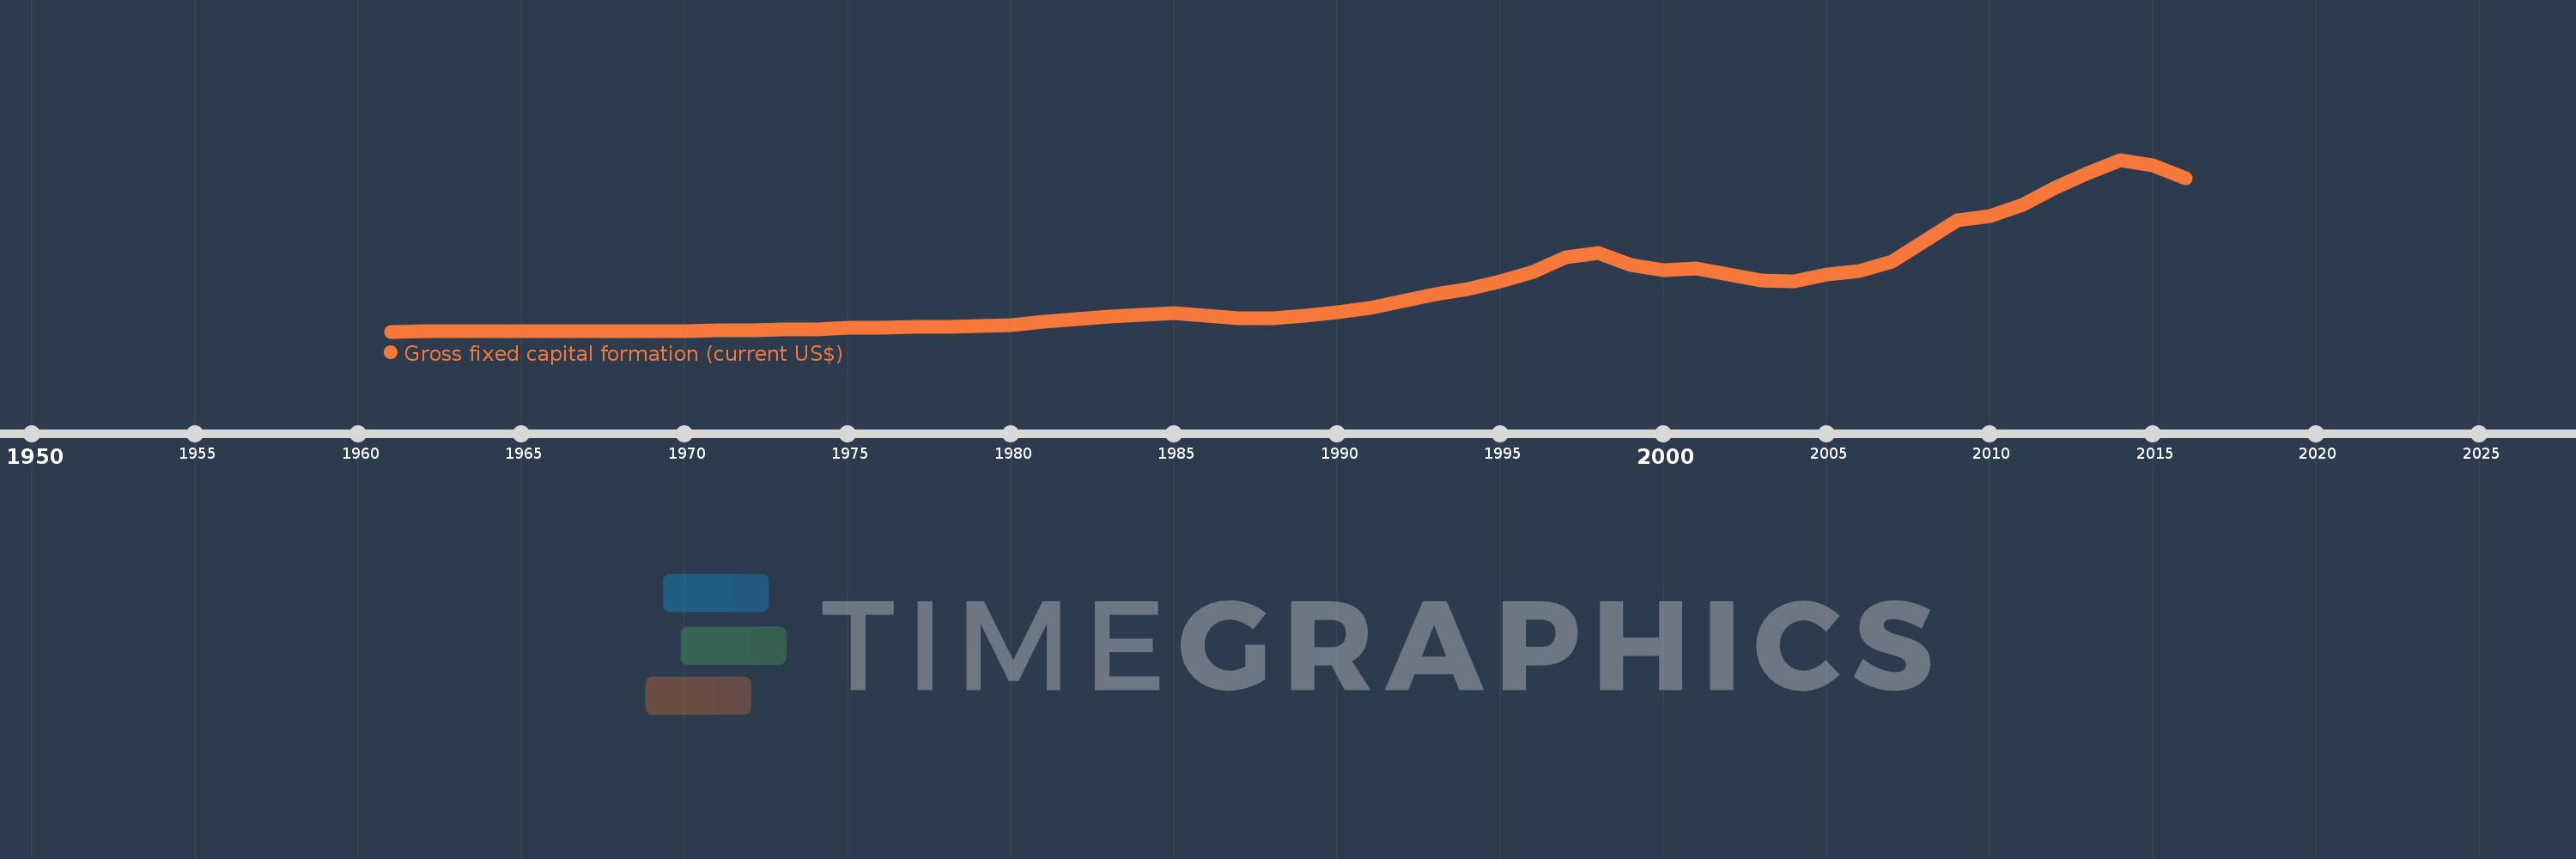
Gross fixed capital formation (current US$)
2016,2015,2014,2013,2012,2011,2010,2009,2008,2007,2006,2005,2004,2003,2002,2001,2000,1999,1998,1997,1996,1995,1994,1993,1992,1991,1990,1989,1988,1987,1986,1985,1984,1983,1982,1981,1980,1979,1978,1977,1976,1975,1974,1973,1972,1971,1970,1969,1968,1967,1966,1965,1964,1963,1962,1961
Estas estadísticas en otros países:
AfghanistanAlbaniaAlgeriaAngolaAntigua and BarbudaArab WorldArgentinaArmeniaArubaAustraliaAustriaAzerbaijanBahamas, TheBahrainBangladeshBarbadosBelarusBelgiumBelizeBeninBermudaBhutanBoliviaBosnia and HerzegovinaBotswanaBrazilBrunei DarussalamBulgariaBurkina FasoBurundiCabo VerdeCambodiaCameroonCanadaCaribbean small statesCentral African RepublicCentral Europe and the BalticsChadChileChinaColombiaComorosCongo, Dem. Rep.Congo, Rep.Costa RicaCote d'IvoireCroatiaCubaCyprusCzech RepublicDenmarkDjiboutiDominicaDominican RepublicEarly-demographic dividendEast Asia & PacificEast Asia & Pacific (excluding high income)East Asia & Pacific (IDA & IBRD countries)EcuadorEgypt, Arab Rep.El SalvadorEquatorial GuineaEritreaEstoniaEthiopiaEuro areaEurope & Central AsiaEurope & Central Asia (excluding high income)Europe & Central Asia (IDA & IBRD countries)European UnionFijiFinlandFragile and conflict affected situationsFranceGabonGambia, TheGeorgiaGermanyGhanaGreeceGrenadaGuatemalaGuineaGuinea-BissauGuyanaHaitiHeavily indebted poor countries (HIPC)High incomeHondurasHong Kong SAR, ChinaHungaryIBRD onlyIcelandIDA & IBRD totalIDA blendIDA onlyIDA totalIndiaIndonesiaIran, Islamic Rep.IraqIrelandIsraelItalyJamaicaJapanJordanKazakhstanKenyaKiribatiKorea, Rep.KosovoKuwaitKyrgyz RepublicLao PDRLate-demographic dividendLatin America & Caribbean Latin America & Caribbean (excluding high income)Latin America & the Caribbean (IDA & IBRD countries)LatviaLeast developed countries: UN classificationLebanonLesothoLiberiaLibyaLithuaniaLow & middle incomeLow incomeLower middle incomeLuxembourgMacao SAR, ChinaMacedonia, FYRMadagascarMalawiMalaysiaMaldivesMaliMaltaMauritaniaMauritiusMexicoMicronesia, Fed. Sts.Middle East & North AfricaMiddle East & North Africa (excluding high income)Middle East & North Africa (IDA & IBRD countries)Middle incomeMoldovaMongoliaMontenegroMoroccoMozambiqueNamibiaNepalNetherlandsNew CaledoniaNew ZealandNicaraguaNigerNigeriaNorth AmericaNorwayOECD membersOmanPakistanPanamaPapua New GuineaParaguayPeruPhilippinesPolandPortugalPost-demographic dividendPre-demographic dividendPuerto RicoRomaniaRussian FederationRwandaSaudi ArabiaSenegalSerbiaSeychellesSierra LeoneSingaporeSlovak RepublicSloveniaSolomon IslandsSomaliaSouth AfricaSouth AsiaSouth Asia (IDA & IBRD)South SudanSpainSri LankaSt. Kitts and NevisSt. LuciaSt. Vincent and the GrenadinesSub-Saharan Africa Sub-Saharan Africa (excluding high income)Sub-Saharan Africa (IDA & IBRD countries)SudanSurinameSwazilandSwedenSwitzerlandSyrian Arab RepublicTajikistanTanzaniaThailandTimor-LesteTogoTongaTrinidad and TobagoTunisiaTurkeyTurkmenistanUgandaUkraineUnited Arab EmiratesUnited KingdomUnited StatesUpper middle incomeUruguayUzbekistanVanuatuVenezuela, RBVietnamWest Bank and GazaWorldYemen, Rep.ZambiaZimbabwe línea de tiempo (timeline):
En esta escala de tiempo se presenta un gráfico de 1961 y 2016 de Singapore. Los datos de 1960 están ausentes. El número de observaciones reales por fecha: 56.
Fuente (nombre):
Indicadores del desarrollo mundial
Fuente (organización):
World Bank national accounts data, and OECD National Accounts data files.
Categorías:
Economy & Growth
Se ha actualizado:
23 abr 2017 año
Los indicadores de los cambios de valor en los últimos años
Mínimo:
66.935 millones
1 ene 1961 año
Máximo:
83.85 bn
1 ene 2014 año
A la fecha de observación
Valor
Cambio absoluto
El cambio con respecto al valor anterior
1 ene 1961 año
66.935 millones
+66.935 millones
0.0%
1 ene 1962 año
97.119 millones
+30.184 millones
45.1%
1 ene 1963 año
117.438 millones
+20.319 millones
20.92%
1 ene 1964 año
145.727 millones
+28.29 millones
24.09%
1 ene 1965 año
178.721 millones
+32.994 millones
22.64%
1 ene 1966 año
204.168 millones
+25.448 millones
14.24%
1 ene 1967 año
214.066 millones
+9.898 millones
4.85%
1 ene 1968 año
241.082 millones
+27.016 millones
12.62%
1 ene 1969 año
325.624 millones
+84.542 millones
35.07%
1 ene 1970 año
433.065 millones
+107.442 millones
33.0%
1 ene 1971 año
616.915 millones
+183.849 millones
42.45%
1 ene 1972 año
819.091 millones
+202.176 millones
32.77%
1 ene 1973 año
1.014 bn
+194.644 millones
23.76%
1 ene 1974 año
1.282 bn
+268.505 millones
26.49%
1 ene 1975 año
1.958 bn
+676.171 millones
52.73%
1 ene 1976 año
1.965 bn
+6.996 millones
0.36%
1 ene 1977 año
2.212 bn
+247.008 millones
12.57%
1 ene 1978 año
2.194 bn
-18.389 millones
-0.83%
1 ene 1979 año
2.603 bn
+408.786 millones
18.63%
1 ene 1980 año
3.308 bn
+705.279 millones
27.1%
1 ene 1981 año
4.701 bn
+1.393 bn
42.1%
1 ene 1982 año
5.973 bn
+1.272 bn
27.05%
1 ene 1983 año
7.369 bn
+1.396 bn
23.38%
1 ene 1984 año
8.198 bn
+829.546 millones
11.26%
1 ene 1985 año
9.127 bn
+928.755 millones
11.33%
1 ene 1986 año
7.813 bn
-1.314 bn
-14.4%
1 ene 1987 año
6.528 bn
-1.285 bn
-16.44%
1 ene 1988 año
6.769 bn
+240.604 millones
3.69%
1 ene 1989 año
7.685 bn
+916.095 millones
13.53%
1 ene 1990 año
9.65 bn
+1.965 bn
25.57%
1 ene 1991 año
11.464 bn
+1.814 bn
18.8%
1 ene 1992 año
15.067 bn
+3.603 bn
31.43%
1 ene 1993 año
18.346 bn
+3.279 bn
21.76%
1 ene 1994 año
20.992 bn
+2.646 bn
14.42%
1 ene 1995 año
24.574 bn
+3.583 bn
17.07%
1 ene 1996 año
29.132 bn
+4.558 bn
18.55%
1 ene 1997 año
36.493 bn
+7.361 bn
25.27%
1 ene 1998 año
38.53 bn
+2.037 bn
5.58%
1 ene 1999 año
32.652 bn
-5.878 bn
-15.26%
1 ene 2000 año
29.841 bn
-2.811 bn
-8.61%
1 ene 2001 año
30.709 bn
+867.46 millones
2.91%
1 ene 2002 año
27.729 bn
-2.98 bn
-9.7%
1 ene 2003 año
24.979 bn
-2.75 bn
-9.92%
1 ene 2004 año
24.496 bn
-482.448 millones
-1.93%
1 ene 2005 año
28.002 bn
+3.506 bn
14.31%
1 ene 2006 año
29.402 bn
+1.4 bn
5.0%
1 ene 2007 año
34.083 bn
+4.681 bn
15.92%
1 ene 2008 año
44.062 bn
+9.979 bn
29.28%
1 ene 2009 año
54.472 bn
+10.41 bn
23.63%
1 ene 2010 año
56.32 bn
+1.848 bn
3.39%
1 ene 2011 año
61.771 bn
+5.451 bn
9.68%
1 ene 2012 año
70.363 bn
+8.592 bn
13.91%
1 ene 2013 año
77.416 bn
+7.054 bn
10.02%
1 ene 2014 año
83.85 bn
+6.434 bn
8.31%
1 ene 2015 año
81.327 bn
-2.523 bn
-3.01%
1 ene 2016 año
74.681 bn
-6.647 bn
-8.17%
Ranking de los países por los datos estadísticos actuales


Comentarios: