29
/es/
es
AIzaSyAYiBZKx7MnpbEhh9jyipgxe19OcubqV5w
April 1, 2024
236899
Serbia
SRB
true
2
1
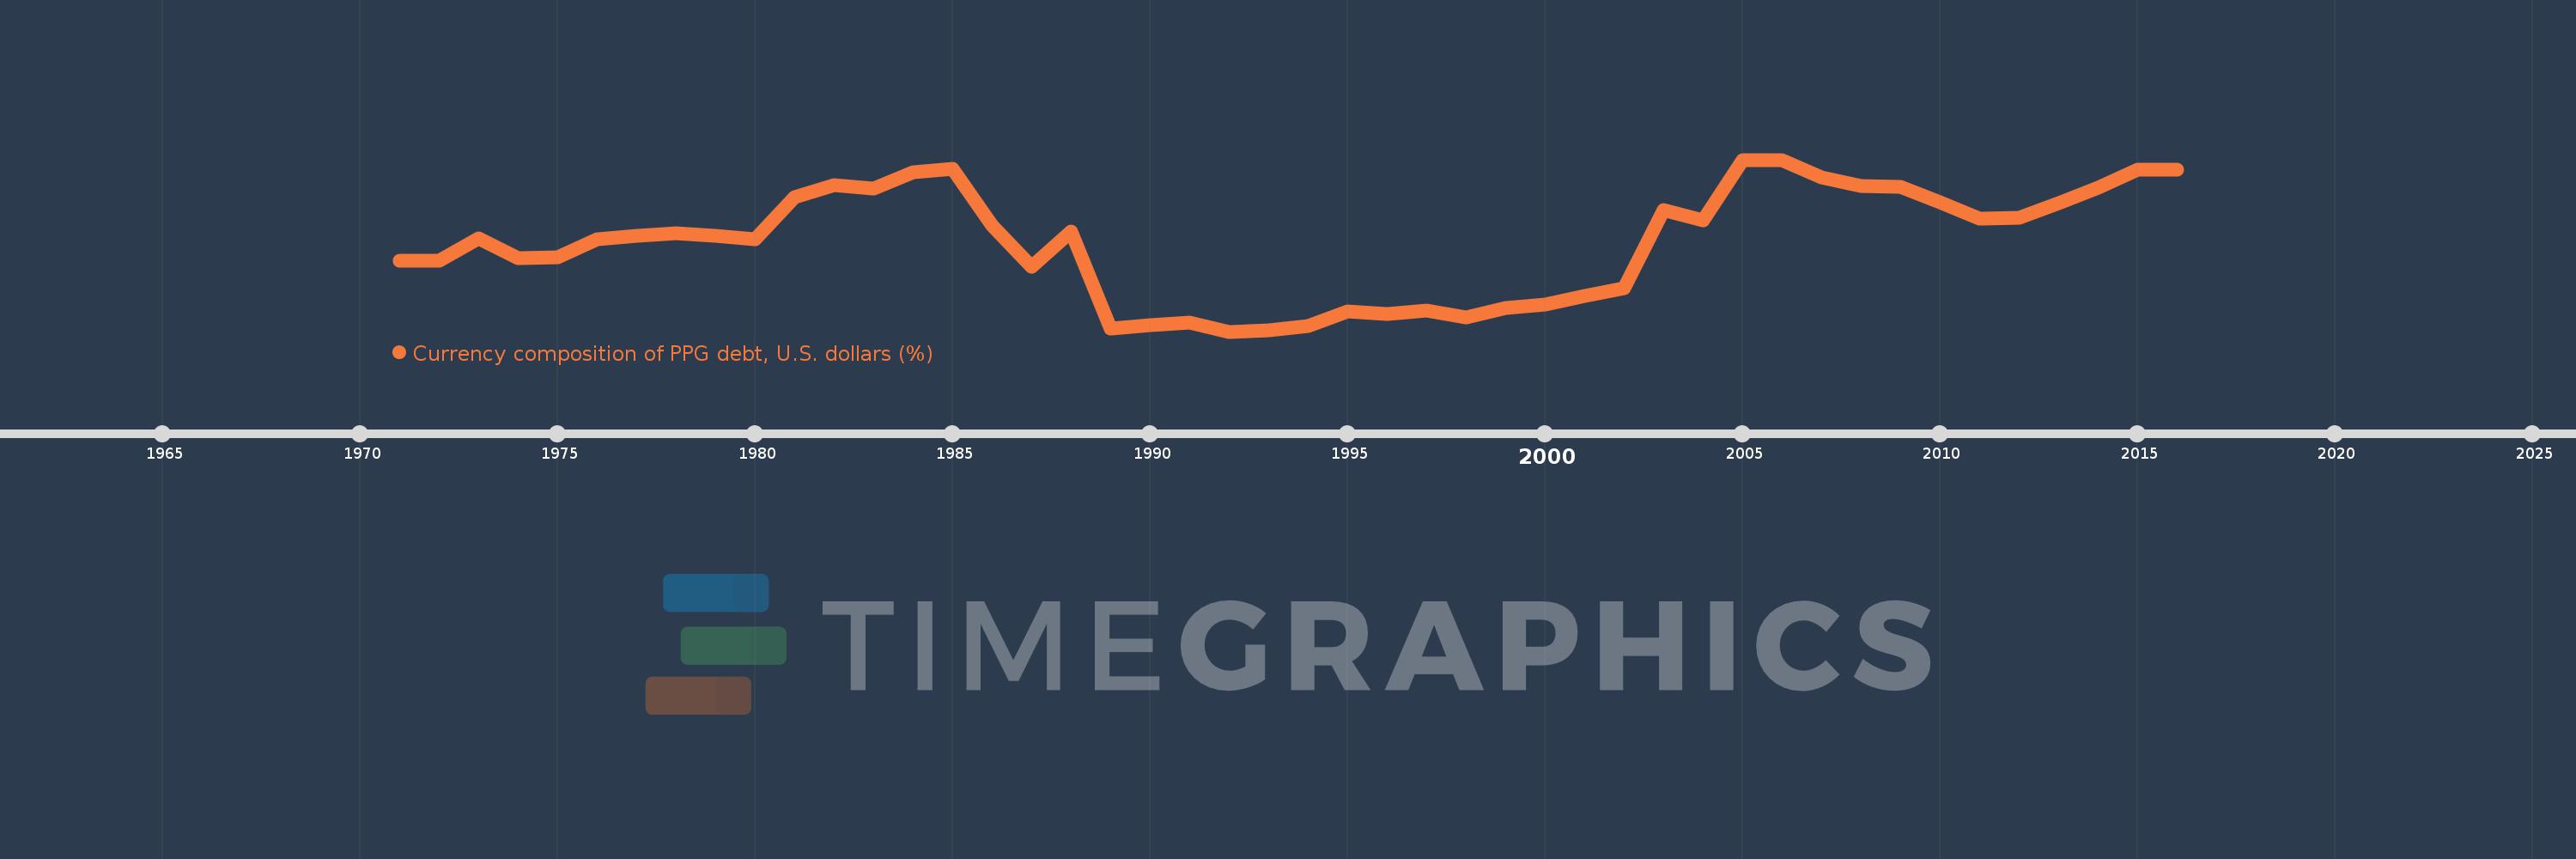
Currency composition of PPG debt, U.S. dollars (%)
2016,2015,2014,2013,2012,2011,2010,2009,2008,2007,2006,2005,2004,2003,2002,2001,2000,1999,1998,1997,1996,1995,1994,1993,1992,1991,1990,1989,1988,1987,1986,1985,1984,1983,1982,1981,1980,1979,1978,1977,1976,1975,1974,1973,1972,1971
Estas estadísticas en otros países:
línea de tiempo (timeline):
En esta escala de tiempo se presenta un gráfico de 1971 y 2016 de Serbia. Los datos de 1970 están ausentes. El número de observaciones reales por fecha: 46.
Fuente (nombre):
Indicadores del desarrollo mundial
Fuente (organización):
World Bank, International Debt Statistics.
Categorías:
External Debt
Se ha actualizado:
23 abr 2017 año
Los indicadores de los cambios de valor en los últimos años
Mínimo:
14.847
1 ene 1992 año
Máximo:
62.484
1 ene 2006 año
A la fecha de observación
Valor
Cambio absoluto
El cambio con respecto al valor anterior
1 ene 1971 año
34.437
+34.437
0.0%
1 ene 1972 año
34.565
+0.128
0.37%
1 ene 1973 año
40.802
+6.237
18.04%
1 ene 1974 año
35.187
-5.614
-13.76%
1 ene 1975 año
35.458
+0.27
0.77%
1 ene 1976 año
40.494
+5.036
14.2%
1 ene 1977 año
41.337
+0.843
2.08%
1 ene 1978 año
42.205
+0.869
2.1%
1 ene 1979 año
41.454
-0.752
-1.78%
1 ene 1980 año
40.342
-1.112
-2.68%
1 ene 1981 año
52.213
+11.871
29.43%
1 ene 1982 año
55.406
+3.193
6.11%
1 ene 1983 año
54.392
-1.014
-1.83%
1 ene 1984 año
59.051
+4.659
8.57%
1 ene 1985 año
60.034
+0.983
1.66%
1 ene 1986 año
44.204
-15.83
-26.37%
1 ene 1987 año
32.933
-11.271
-25.5%
1 ene 1988 año
42.653
+9.72
29.51%
1 ene 1989 año
15.794
-26.859
-62.97%
1 ene 1990 año
16.694
+0.9
5.7%
1 ene 1991 año
17.32
+0.627
3.75%
1 ene 1992 año
14.847
-2.473
-14.28%
1 ene 1993 año
15.274
+0.427
2.88%
1 ene 1994 año
16.359
+1.085
7.11%
1 ene 1995 año
20.482
+4.123
25.2%
1 ene 1996 año
19.836
-0.645
-3.15%
1 ene 1997 año
20.632
+0.796
4.01%
1 ene 1998 año
18.885
-1.747
-8.47%
1 ene 1999 año
21.338
+2.453
12.99%
1 ene 2000 año
22.256
+0.918
4.3%
1 ene 2001 año
24.631
+2.375
10.67%
1 ene 2002 año
26.979
+2.348
9.53%
1 ene 2003 año
48.567
+21.588
80.02%
1 ene 2004 año
45.76
-2.807
-5.78%
1 ene 2005 año
62.348
+16.588
36.25%
1 ene 2006 año
62.484
+0.136
0.22%
1 ene 2007 año
57.694
-4.79
-7.67%
1 ene 2008 año
55.313
-2.38
-4.13%
1 ene 2009 año
55.043
-0.271
-0.49%
1 ene 2010 año
50.597
-4.446
-8.08%
1 ene 2011 año
46.16
-4.437
-8.77%
1 ene 2012 año
46.5
+0.341
0.74%
1 ene 2013 año
50.559
+4.059
8.73%
1 ene 2014 año
54.851
+4.292
8.49%
1 ene 2015 año
59.732
+4.881
8.9%
1 ene 2016 año
59.756
+0.024
0.04%
Ranking de los países por los datos estadísticos actuales


Comentarios: