29
/es/
es
AIzaSyAYiBZKx7MnpbEhh9jyipgxe19OcubqV5w
April 1, 2024
230114
Russian Federation
RUS
true
2
1
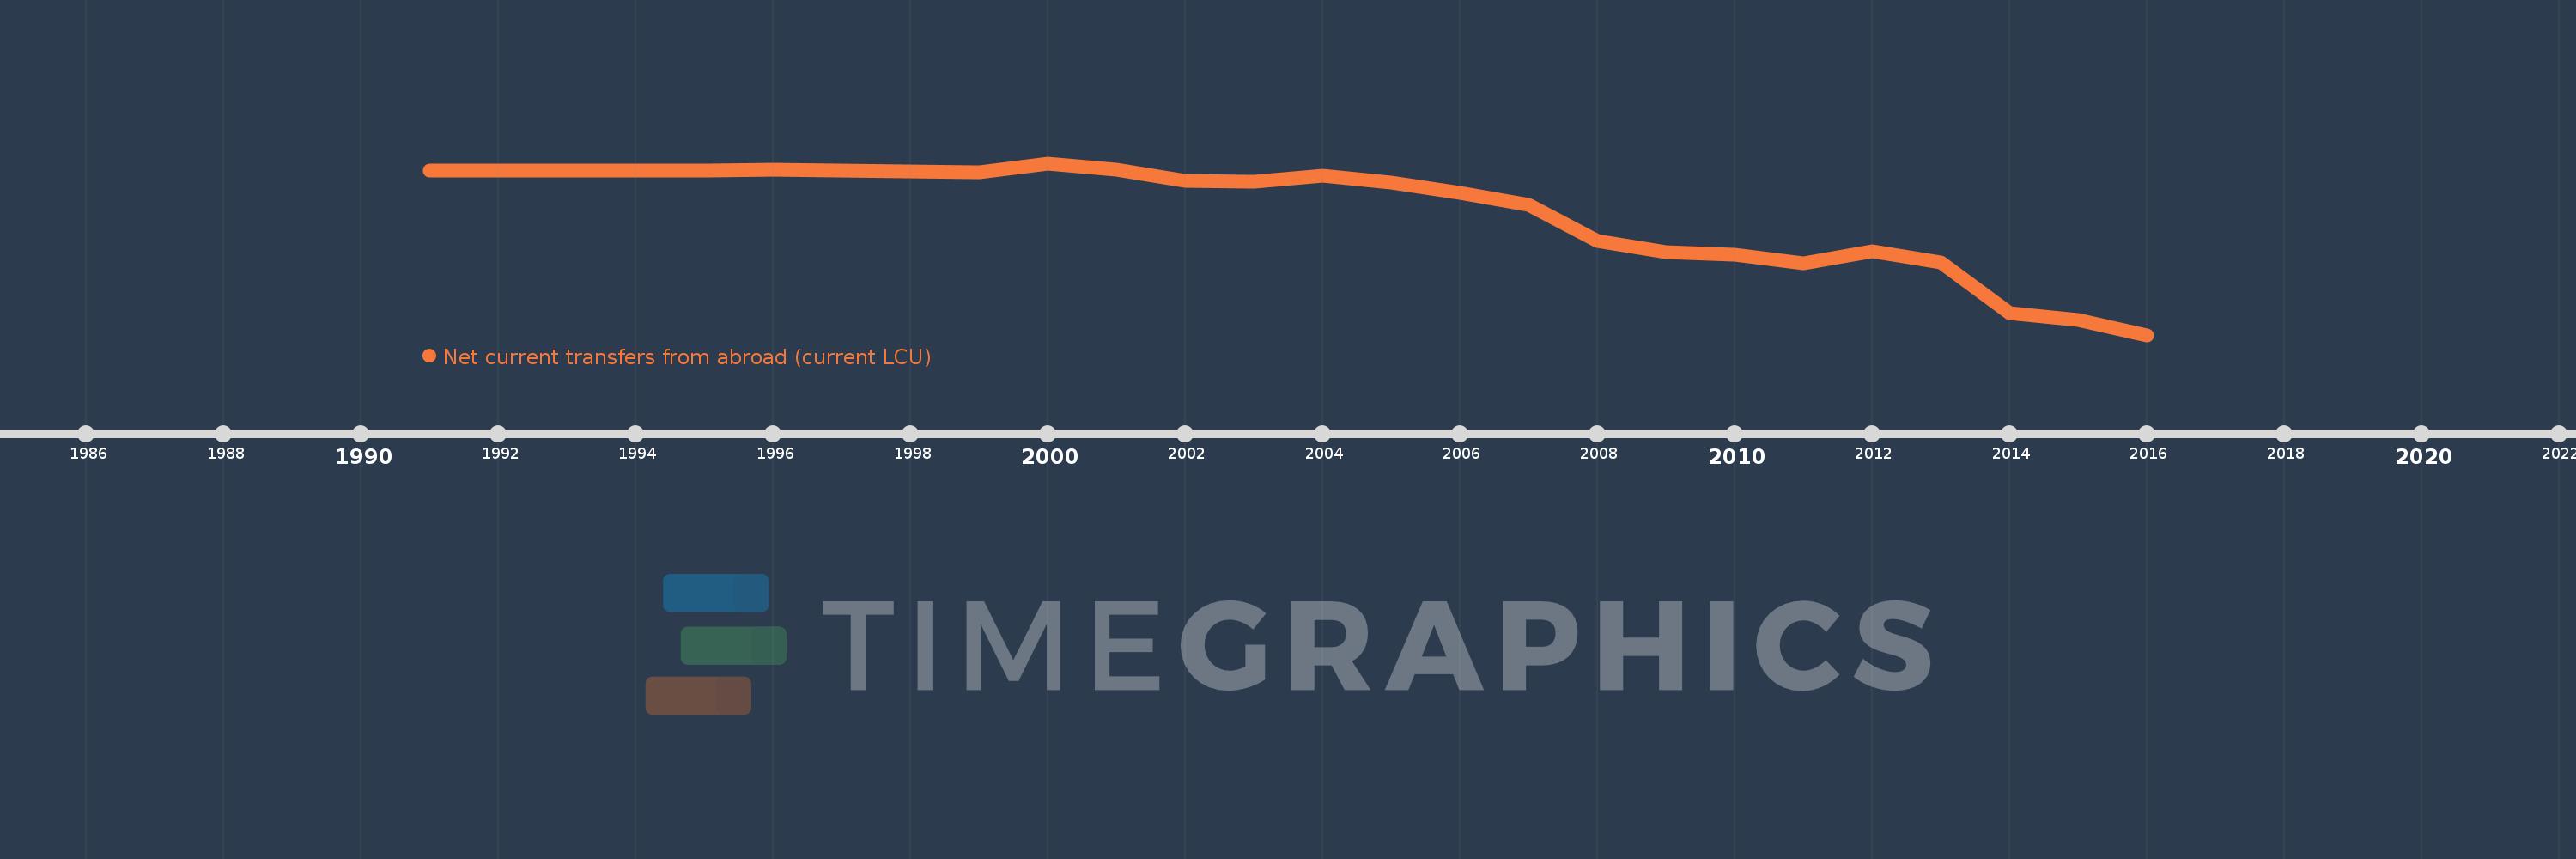
Net current transfers from abroad (current LCU)
2016,2015,2014,2013,2012,2011,2010,2009,2008,2007,2006,2005,2004,2003,2002,2001,2000,1999,1998,1997,1996,1995,1994,1993,1992,1991
Estas estadísticas en otros países:
AfghanistanAlbaniaAlgeriaAngolaAntigua and BarbudaArgentinaArmeniaAustraliaAustriaAzerbaijanBahamas, TheBangladeshBarbadosBelarusBelgiumBelizeBeninBermudaBhutanBoliviaBosnia and HerzegovinaBotswanaBrazilBrunei DarussalamBulgariaBurkina FasoBurundiCabo VerdeCambodiaCameroonCanadaCentral African RepublicChadChileChinaColombiaComorosCongo, Dem. Rep.Congo, Rep.Costa RicaCote d'IvoireCroatiaCzech RepublicDenmarkDjiboutiDominicaDominican RepublicEcuadorEgypt, Arab Rep.El SalvadorEquatorial GuineaEritreaEstoniaEthiopiaFaroe IslandsFijiFinlandFranceFrench PolynesiaGabonGambia, TheGeorgiaGermanyGhanaGreeceGrenadaGuatemalaGuineaGuinea-BissauGuyanaHaitiHondurasHong Kong SAR, ChinaHungaryIcelandIndiaIndonesiaIran, Islamic Rep.IraqIrelandIsraelItalyJamaicaJapanJordanKazakhstanKenyaKiribatiKorea, Rep.KosovoKyrgyz RepublicLao PDRLatviaLebanonLesothoLiberiaLibyaLithuaniaMacedonia, FYRMadagascarMalawiMalaysiaMaldivesMaliMauritaniaMauritiusMexicoMoldovaMongoliaMontenegroMoroccoMozambiqueMyanmarNamibiaNepalNetherlandsNew ZealandNicaraguaNigerNigeriaNorwayPakistanPalauPanamaPapua New GuineaParaguayPeruPhilippinesPolandPortugalRomaniaRussian FederationRwandaSamoaSao Tome and PrincipeSenegalSerbiaSeychellesSierra LeoneSingaporeSlovak RepublicSloveniaSolomon IslandsSouth AfricaSouth SudanSpainSri LankaSt. Kitts and NevisSt. LuciaSt. Vincent and the GrenadinesSudanSurinameSwazilandSwedenSwitzerlandSyrian Arab RepublicTajikistanTanzaniaThailandTimor-LesteTogoTongaTrinidad and TobagoTunisiaTurkeyTurkmenistanUgandaUkraineUnited KingdomUnited StatesUruguayUzbekistanVanuatuVenezuela, RBVietnamWest Bank and GazaYemen, Rep.ZambiaZimbabwe línea de tiempo (timeline):
En esta escala de tiempo se presenta un gráfico de 1991 y 2016 de Russian Federation. Los datos de 1990 están ausentes. El número de observaciones reales por fecha: 26.
Fuente (nombre):
Indicadores del desarrollo mundial
Fuente (organización):
World Bank national accounts data, and OECD National Accounts data files.
Categorías:
Economy & Growth
Se ha actualizado:
23 abr 2017 año
Los indicadores de los cambios de valor en los últimos años
Mínimo:
-341.398 bn
1 ene 2016 año
Máximo:
14.797 bn
1 ene 2000 año
A la fecha de observación
Valor
Cambio absoluto
El cambio con respecto al valor anterior
1 ene 1991 año
0.0
0.0
0.0%
1 ene 1995 año
-360.186 millones
-360.186 millones
%
1 ene 1996 año
567.025 millones
+927.211 millones
-257.43%
1 ene 1997 año
369.042 millones
-197.983 millones
-34.92%
1 ene 1998 año
-2.059 bn
-2.429 bn
-658.06%
1 ene 1999 año
-3.271 bn
-1.211 bn
58.81%
1 ene 2000 año
14.797 bn
+18.067 bn
-552.42%
1 ene 2001 año
1.941 bn
-12.856 bn
-86.88%
1 ene 2002 año
-22.14 bn
-24.081 bn
-1.24 mil%
1 ene 2003 año
-23.512 bn
-1.372 bn
6.2%
1 ene 2004 año
-11.172 bn
+12.341 bn
-52.49%
1 ene 2005 año
-24.488 bn
-13.317 bn
119.2%
1 ene 2006 año
-46.514 bn
-22.025 bn
89.94%
1 ene 2007 año
-71.259 bn
-24.746 bn
53.2%
1 ene 2008 año
-146.005 bn
-74.745 bn
104.89%
1 ene 2009 año
-168.702 bn
-22.697 bn
15.55%
1 ene 2010 año
-174.8 bn
-6.098 bn
3.61%
1 ene 2011 año
-191.865 bn
-17.066 bn
9.76%
1 ene 2012 año
-168.019 bn
+23.846 bn
-12.43%
1 ene 2013 año
-190.559 bn
-22.54 bn
13.42%
1 ene 2014 año
-295.11 bn
-104.552 bn
54.87%
1 ene 2015 año
-310.518 bn
-15.408 bn
5.22%
1 ene 2016 año
-341.398 bn
-30.88 bn
9.94%
Ranking de los países por los datos estadísticos actuales


Comentarios: