29
/es/
es
AIzaSyAYiBZKx7MnpbEhh9jyipgxe19OcubqV5w
April 1, 2024
228580
Romania
ROU
true
2
1
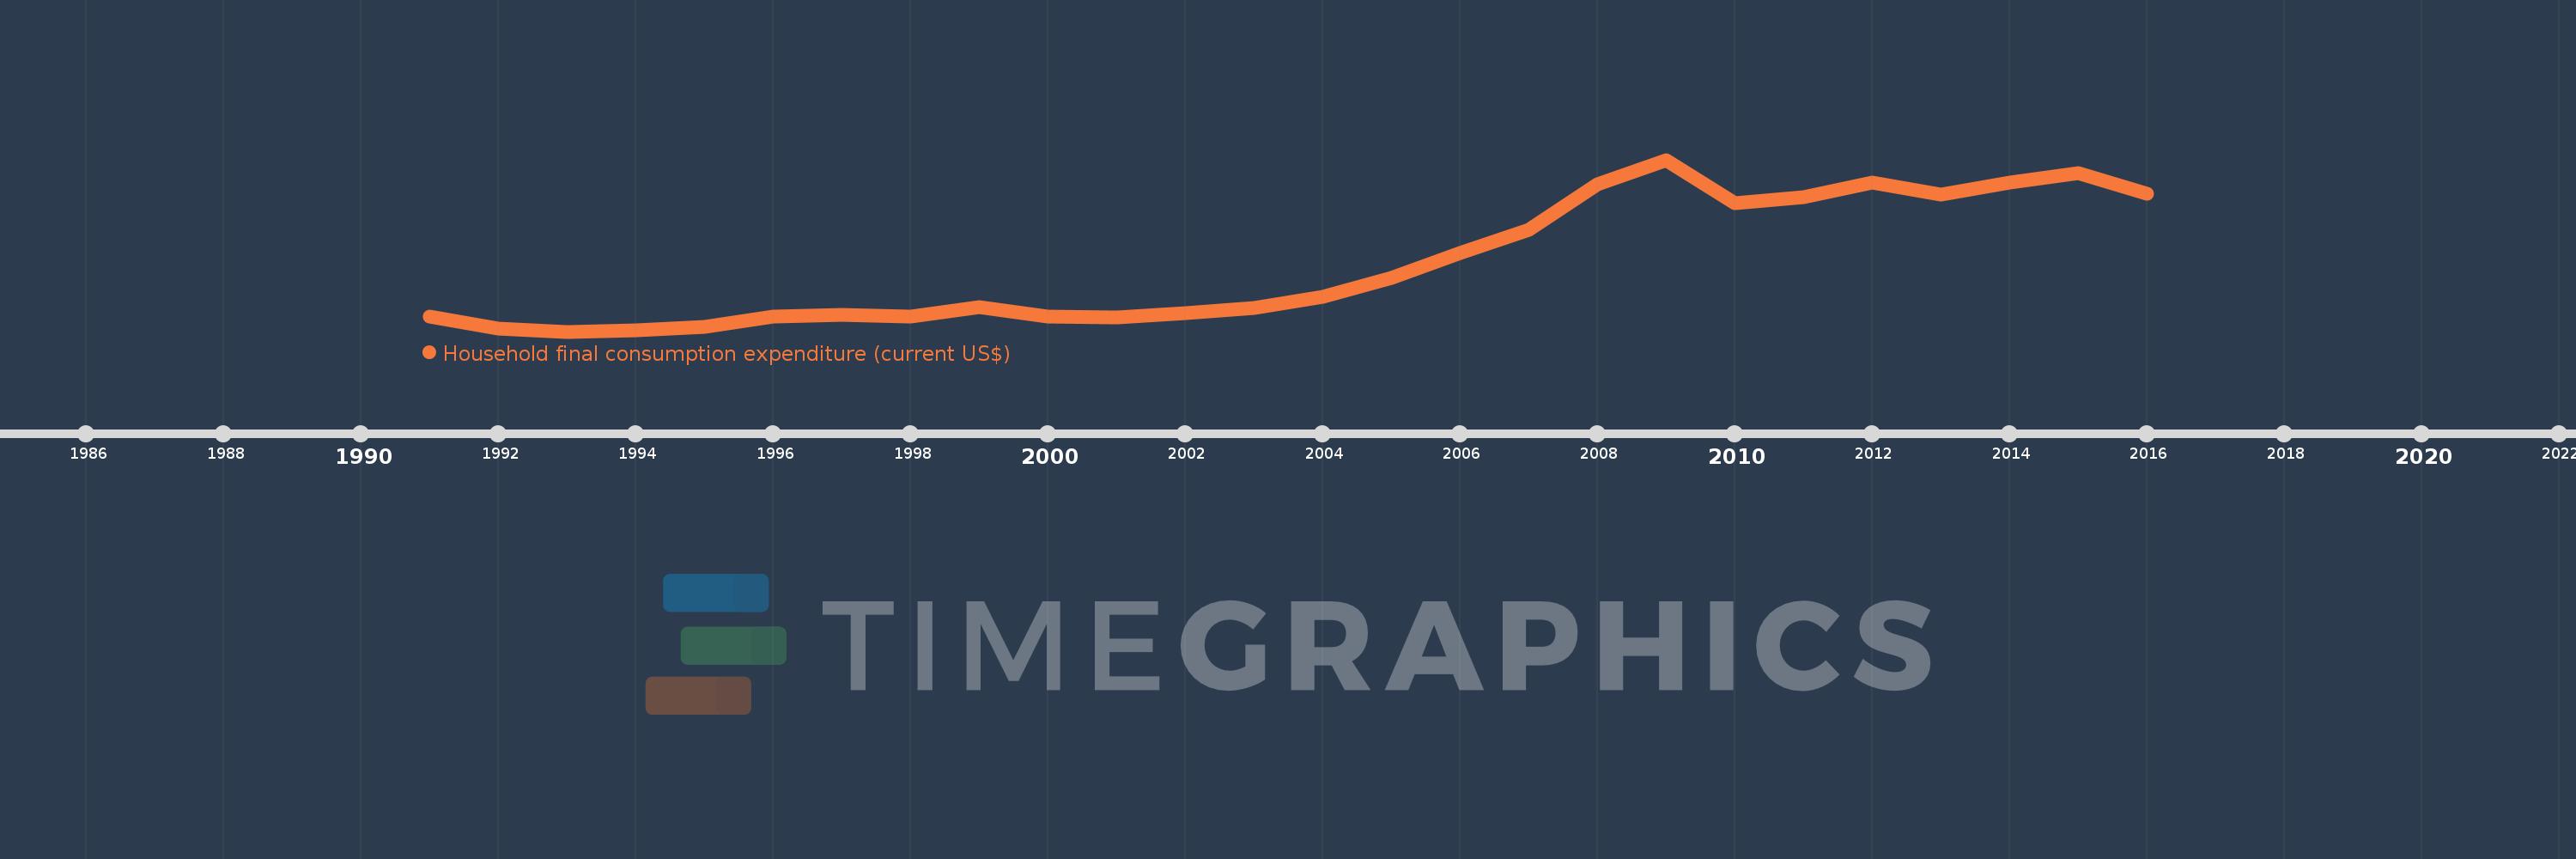
Household final consumption expenditure (current US$)
2016,2015,2014,2013,2012,2011,2010,2009,2008,2007,2006,2005,2004,2003,2002,2001,2000,1999,1998,1997,1996,1995,1994,1993,1992,1991
Estas estadísticas en otros países:
AfghanistanAlbaniaAlgeriaAngolaAntigua and BarbudaArab WorldArgentinaArmeniaArubaAustraliaAustriaAzerbaijanBahamas, TheBahrainBangladeshBarbadosBelarusBelgiumBelizeBeninBermudaBhutanBoliviaBosnia and HerzegovinaBotswanaBrazilBrunei DarussalamBulgariaBurkina FasoBurundiCabo VerdeCambodiaCameroonCanadaCaribbean small statesCentral African RepublicCentral Europe and the BalticsChadChileChinaColombiaComorosCongo, Dem. Rep.Congo, Rep.Costa RicaCote d'IvoireCroatiaCubaCyprusCzech RepublicDenmarkDjiboutiDominicaDominican RepublicEarly-demographic dividendEast Asia & PacificEast Asia & Pacific (excluding high income)East Asia & Pacific (IDA & IBRD countries)EcuadorEgypt, Arab Rep.El SalvadorEquatorial GuineaEritreaEstoniaEthiopiaEuro areaEurope & Central AsiaEurope & Central Asia (excluding high income)Europe & Central Asia (IDA & IBRD countries)European UnionFaroe IslandsFijiFinlandFranceGabonGambia, TheGeorgiaGermanyGhanaGreeceGrenadaGuatemalaGuineaGuinea-BissauGuyanaHaitiHeavily indebted poor countries (HIPC)High incomeHondurasHong Kong SAR, ChinaHungaryIBRD onlyIcelandIDA & IBRD totalIDA blendIDA onlyIDA totalIndiaIndonesiaIran, Islamic Rep.IrelandIsraelItalyJamaicaJapanJordanKazakhstanKenyaKiribatiKorea, Rep.KosovoKuwaitKyrgyz RepublicLao PDRLate-demographic dividendLatin America & Caribbean Latin America & Caribbean (excluding high income)Latin America & the Caribbean (IDA & IBRD countries)LatviaLeast developed countries: UN classificationLebanonLesothoLiberiaLibyaLithuaniaLow & middle incomeLow incomeLower middle incomeLuxembourgMacao SAR, ChinaMacedonia, FYRMadagascarMalawiMalaysiaMaliMaltaMauritaniaMauritiusMexicoMicronesia, Fed. Sts.Middle East & North AfricaMiddle East & North Africa (excluding high income)Middle East & North Africa (IDA & IBRD countries)Middle incomeMoldovaMongoliaMontenegroMoroccoMozambiqueNamibiaNepalNetherlandsNew CaledoniaNew ZealandNicaraguaNigerNigeriaNorth AmericaNorwayOECD membersOmanOther small statesPakistanPanamaPapua New GuineaParaguayPeruPhilippinesPolandPortugalPost-demographic dividendPre-demographic dividendPuerto RicoQatarRomaniaRussian FederationRwandaSaudi ArabiaSenegalSerbiaSeychellesSierra LeoneSingaporeSlovak RepublicSloveniaSmall statesSolomon IslandsSomaliaSouth AfricaSouth AsiaSouth Asia (IDA & IBRD)South SudanSpainSri LankaSt. Kitts and NevisSt. LuciaSt. Vincent and the GrenadinesSub-Saharan Africa Sub-Saharan Africa (excluding high income)Sub-Saharan Africa (IDA & IBRD countries)SudanSurinameSwazilandSwedenSwitzerlandSyrian Arab RepublicTajikistanTanzaniaThailandTimor-LesteTogoTongaTrinidad and TobagoTunisiaTurkeyTurkmenistanUgandaUkraineUnited Arab EmiratesUnited KingdomUnited StatesUpper middle incomeUruguayUzbekistanVanuatuVenezuela, RBVietnamWest Bank and GazaWorldYemen, Rep.ZambiaZimbabwe línea de tiempo (timeline):
En esta escala de tiempo se presenta un gráfico de 1991 y 2016 de Romania. Los datos de 1990 están ausentes. El número de observaciones reales por fecha: 26.
Fuente (nombre):
Indicadores del desarrollo mundial
Fuente (organización):
World Bank national accounts data, and OECD National Accounts data files.
Categorías:
Economy & Growth
Se ha actualizado:
23 abr 2017 año
Los indicadores de los cambios de valor en los últimos años
Mínimo:
15.756 bn
1 ene 1993 año
Máximo:
132.139 bn
1 ene 2009 año
A la fecha de observación
Valor
Cambio absoluto
El cambio con respecto al valor anterior
1 ene 1991 año
25.691 bn
+25.691 bn
0.0%
1 ene 1992 año
17.613 bn
-8.078 bn
-31.44%
1 ene 1993 año
15.756 bn
-1.857 bn
-10.54%
1 ene 1994 año
16.793 bn
+1.037 bn
6.58%
1 ene 1995 año
19.094 bn
+2.301 bn
13.7%
1 ene 1996 año
25.889 bn
+6.795 bn
35.59%
1 ene 1997 año
27.032 bn
+1.142 bn
4.41%
1 ene 1998 año
25.863 bn
-1.169 bn
-4.32%
1 ene 1999 año
32.272 bn
+6.409 bn
24.78%
1 ene 2000 año
25.931 bn
-6.342 bn
-19.65%
1 ene 2001 año
25.568 bn
-362.567 millones
-1.4%
1 ene 2002 año
28.106 bn
+2.538 bn
9.93%
1 ene 2003 año
31.554 bn
+3.448 bn
12.27%
1 ene 2004 año
39.405 bn
+7.852 bn
24.88%
1 ene 2005 año
52.328 bn
+12.923 bn
32.79%
1 ene 2006 año
68.965 bn
+16.637 bn
31.79%
1 ene 2007 año
84.566 bn
+15.6 bn
22.62%
1 ene 2008 año
115.454 bn
+30.888 bn
36.53%
1 ene 2009 año
132.139 bn
+16.685 bn
14.45%
1 ene 2010 año
102.588 bn
-29.55 bn
-22.36%
1 ene 2011 año
106.549 bn
+3.961 bn
3.86%
1 ene 2012 año
116.592 bn
+10.042 bn
9.43%
1 ene 2013 año
108.407 bn
-8.185 bn
-7.02%
1 ene 2014 año
116.807 bn
+8.4 bn
7.75%
1 ene 2015 año
123.016 bn
+6.209 bn
5.32%
1 ene 2016 año
109.339 bn
-13.677 bn
-11.12%
Ranking de los países por los datos estadísticos actuales


Comentarios: