29
/es/
es
AIzaSyAYiBZKx7MnpbEhh9jyipgxe19OcubqV5w
April 1, 2024
228364
Romania
ROU
true
2
1
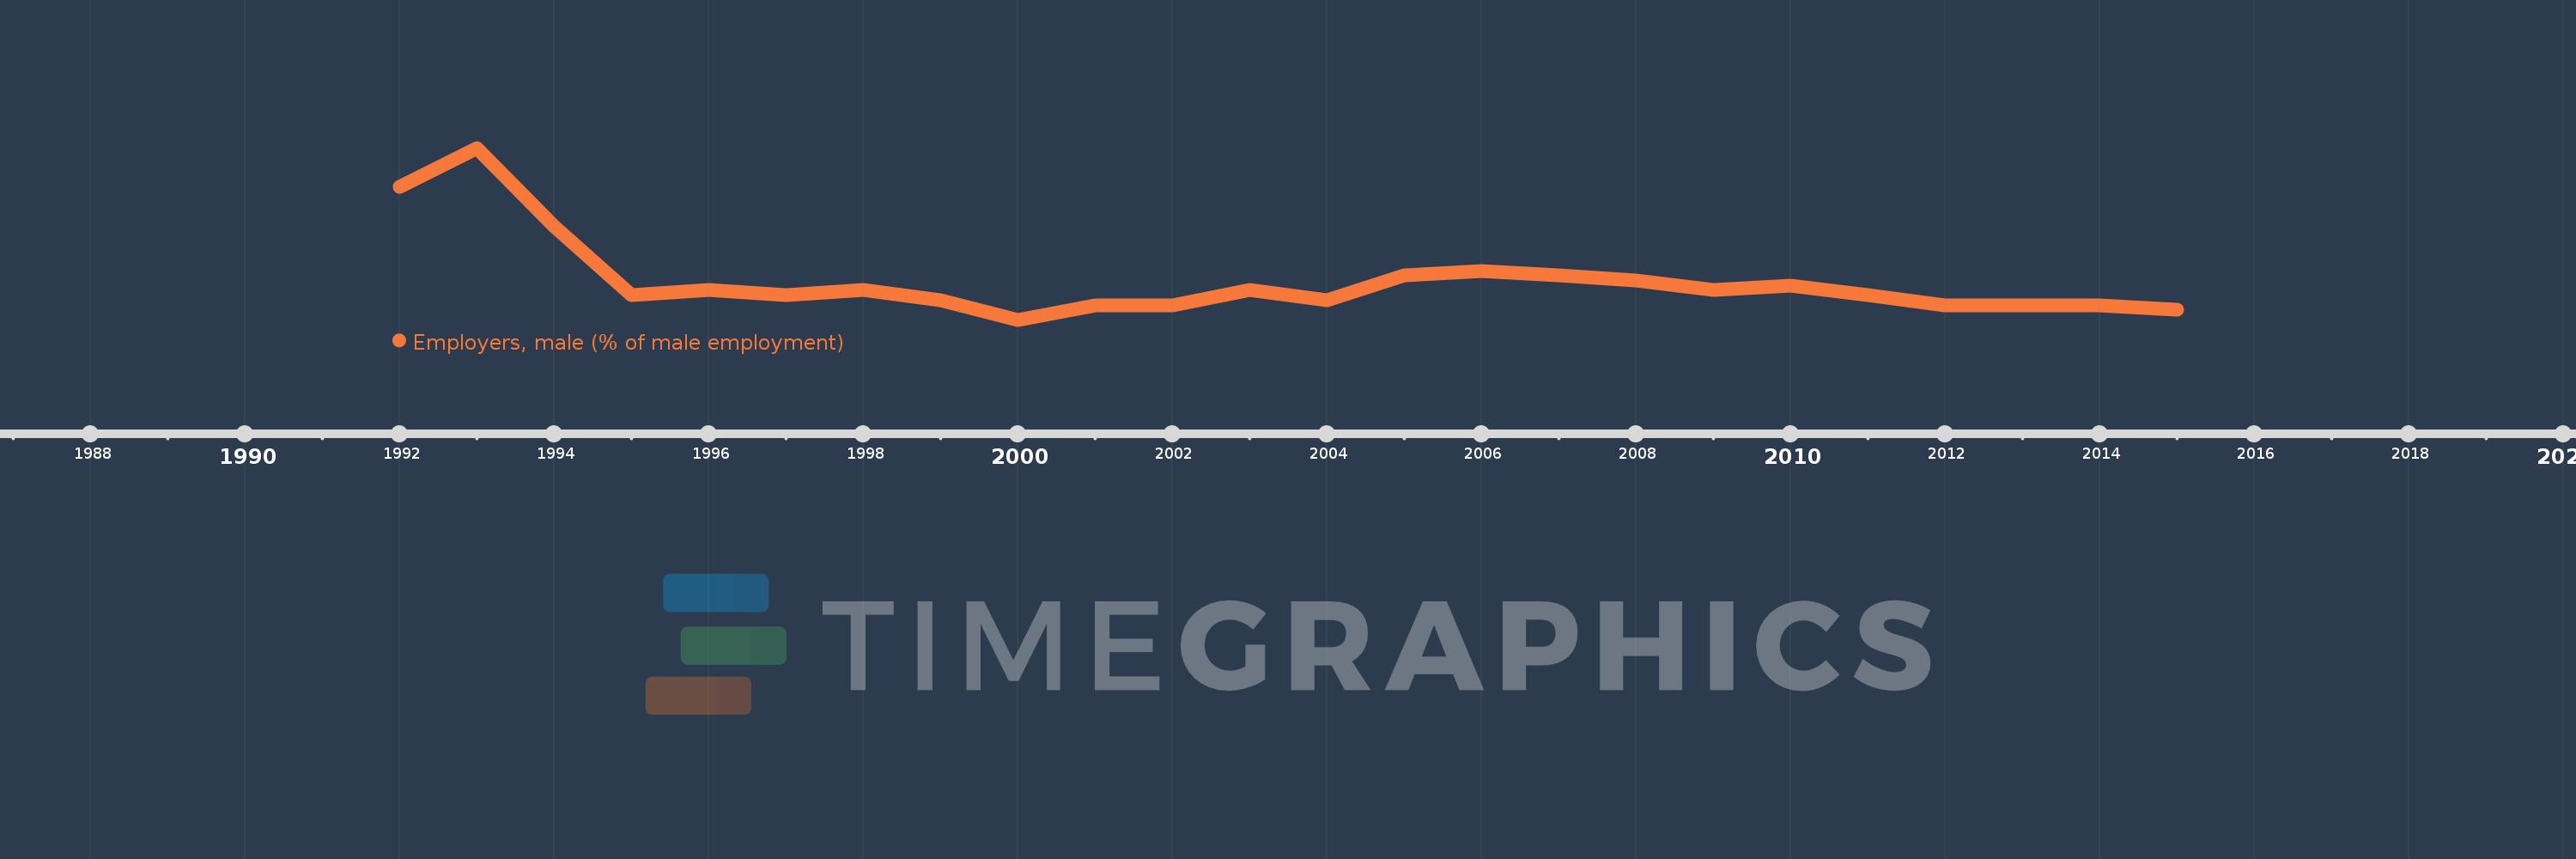
Employers, male (% of male employment)
2015,2014,2013,2012,2011,2010,2009,2008,2007,2006,2005,2004,2003,2002,2001,2000,1999,1998,1997,1996,1995,1994,1993,1992
Estas estadísticas en otros países:
línea de tiempo (timeline):
En esta escala de tiempo se presenta un gráfico de 1992 y 2015 de Romania. Los datos de 1991 están ausentes. El número de observaciones reales por fecha: 24.
Fuente (nombre):
Indicadores del desarrollo mundial
Fuente (organización):
ILO Key Indicators of the Labour Market (KILM).
Categorías:
Social Protection & Labor, Gender
Se ha actualizado:
23 abr 2017 año
Los indicadores de los cambios de valor en los últimos años
A la fecha de observación
Valor
Cambio absoluto
El cambio con respecto al valor anterior
1 ene 1992 año
4.0
+4.0
0.0%
1 ene 1993 año
4.8
+0.8
20.0%
1 ene 1994 año
3.2
-1.6
-33.33%
1 ene 1995 año
1.8
-1.4
-43.75%
1 ene 1996 año
1.9
+0.1
5.56%
1 ene 1997 año
1.8
-0.1
-5.26%
1 ene 1998 año
1.9
+0.1
5.56%
1 ene 1999 año
1.7
-0.2
-10.53%
1 ene 2000 año
1.3
-0.4
-23.53%
1 ene 2001 año
1.6
+0.3
23.08%
1 ene 2002 año
1.6
0.0
0.0%
1 ene 2003 año
1.9
+0.3
18.75%
1 ene 2004 año
1.7
-0.2
-10.53%
1 ene 2005 año
2.2
+0.5
29.41%
1 ene 2006 año
2.3
+0.1
4.55%
1 ene 2007 año
2.2
-0.1
-4.35%
1 ene 2008 año
2.1
-0.1
-4.55%
1 ene 2009 año
1.9
-0.2
-9.52%
1 ene 2010 año
2.0
+0.1
5.26%
1 ene 2011 año
1.8
-0.2
-10.0%
1 ene 2012 año
1.6
-0.2
-11.11%
1 ene 2013 año
1.6
0.0
0.0%
1 ene 2014 año
1.6
0.0
0.0%
1 ene 2015 año
1.5
-0.1
-6.25%
Ranking de los países por los datos estadísticos actuales


Comentarios: