29
/es/
es
AIzaSyAYiBZKx7MnpbEhh9jyipgxe19OcubqV5w
April 1, 2024
227523
Qatar
QAT
true
2
1
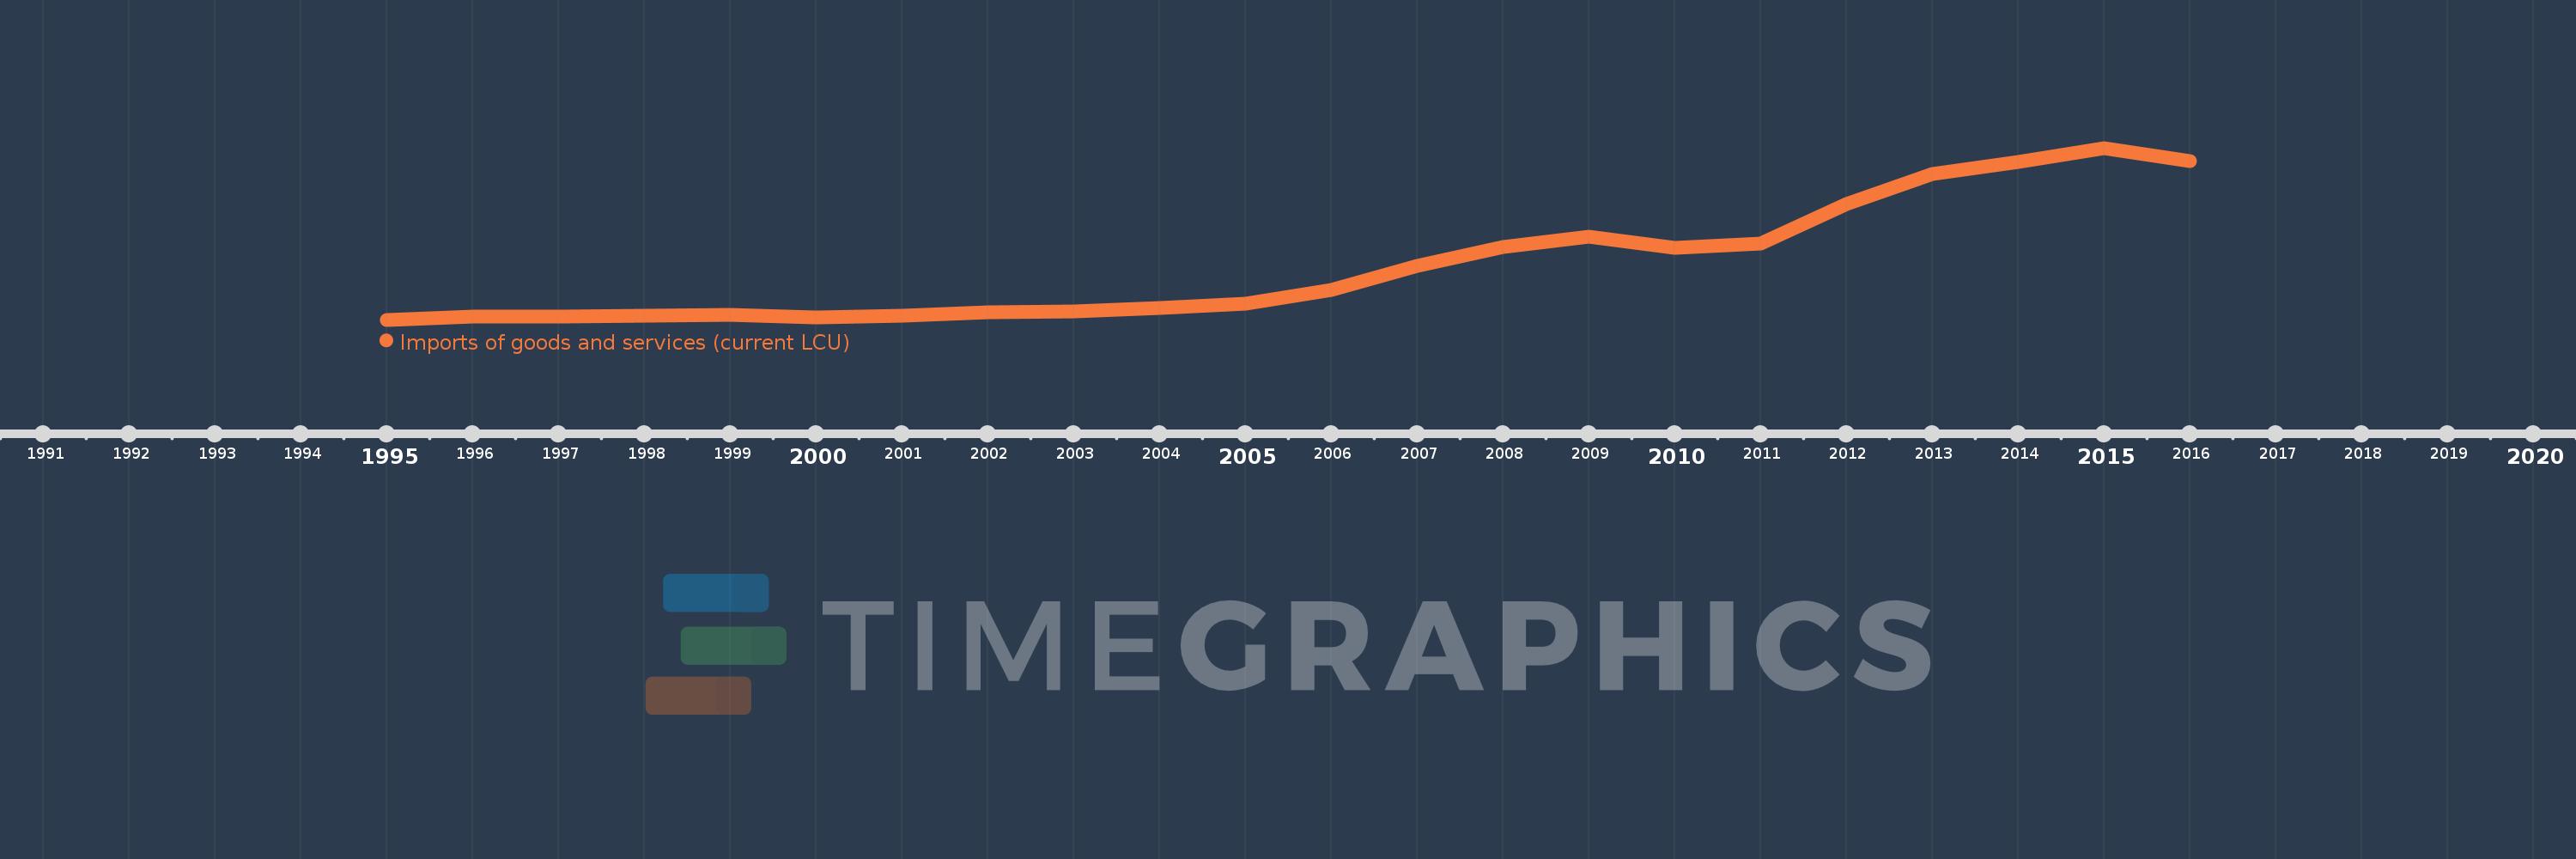
Imports of goods and services (current LCU)
2016,2015,2014,2013,2012,2011,2010,2009,2008,2007,2006,2005,2004,2003,2002,2001,2000,1999,1998,1997,1996,1995
Estas estadísticas en otros países:
AfghanistanAlbaniaAlgeriaAngolaAntigua and BarbudaArgentinaArmeniaArubaAustraliaAustriaAzerbaijanBahamas, TheBahrainBangladeshBarbadosBelarusBelgiumBelizeBeninBermudaBhutanBoliviaBosnia and HerzegovinaBotswanaBrazilBrunei DarussalamBulgariaBurkina FasoBurundiCabo VerdeCambodiaCameroonCanadaCentral African RepublicChadChileChinaColombiaComorosCongo, Dem. Rep.Congo, Rep.Costa RicaCote d'IvoireCroatiaCubaCyprusCzech RepublicDenmarkDjiboutiDominicaDominican RepublicEcuadorEgypt, Arab Rep.El SalvadorEquatorial GuineaEritreaEstoniaEthiopiaFaroe IslandsFijiFinlandFranceFrench PolynesiaGabonGambia, TheGeorgiaGermanyGhanaGreeceGrenadaGuatemalaGuineaGuinea-BissauGuyanaHaitiHondurasHong Kong SAR, ChinaHungaryIcelandIndiaIndonesiaIran, Islamic Rep.IraqIrelandIsraelItalyJamaicaJapanJordanKazakhstanKenyaKiribatiKorea, Rep.KosovoKuwaitKyrgyz RepublicLao PDRLatviaLebanonLesothoLiberiaLibyaLithuaniaLuxembourgMacao SAR, ChinaMacedonia, FYRMadagascarMalawiMalaysiaMaldivesMaliMaltaMauritaniaMauritiusMexicoMicronesia, Fed. Sts.MoldovaMongoliaMontenegroMoroccoMozambiqueMyanmarNamibiaNepalNetherlandsNew CaledoniaNew ZealandNicaraguaNigerNigeriaNorwayOmanPakistanPalauPanamaPapua New GuineaParaguayPeruPhilippinesPolandPortugalPuerto RicoQatarRomaniaRussian FederationRwandaSamoaSaudi ArabiaSenegalSerbiaSeychellesSierra LeoneSingaporeSlovak RepublicSloveniaSolomon IslandsSomaliaSouth AfricaSouth SudanSpainSri LankaSt. Kitts and NevisSt. LuciaSt. Vincent and the GrenadinesSudanSurinameSwazilandSwedenSwitzerlandSyrian Arab RepublicTajikistanTanzaniaThailandTimor-LesteTogoTongaTrinidad and TobagoTunisiaTurkeyTurkmenistanUgandaUkraineUnited Arab EmiratesUnited KingdomUnited StatesUruguayUzbekistanVanuatuVenezuela, RBVietnamWest Bank and GazaYemen, Rep.ZambiaZimbabwe línea de tiempo (timeline):
En esta escala de tiempo se presenta un gráfico de 1995 y 2016 de Qatar. Los datos de 1994 están ausentes. El número de observaciones reales por fecha: 22.
Fuente (nombre):
Indicadores del desarrollo mundial
Fuente (organización):
World Bank national accounts data, and OECD National Accounts data files.
Categorías:
Economy & Growth
Se ha actualizado:
23 abr 2017 año
Los indicadores de los cambios de valor en los últimos años
Mínimo:
9.066 bn
1 ene 1995 año
Máximo:
232.976 bn
1 ene 2015 año
A la fecha de observación
Valor
Cambio absoluto
El cambio con respecto al valor anterior
1 ene 1995 año
9.066 bn
+9.066 bn
0.0%
1 ene 1996 año
12.835 bn
+3.769 bn
41.57%
1 ene 1997 año
13.119 bn
+283.999 millones
2.21%
1 ene 1998 año
14.873 bn
+1.754 bn
13.37%
1 ene 1999 año
14.918 bn
+45.0 millones
0.3%
1 ene 2000 año
11.59 bn
-3.328 bn
-22.31%
1 ene 2001 año
14.435 bn
+2.845 bn
24.55%
1 ene 2002 año
18.562 bn
+4.127 bn
28.59%
1 ene 2003 año
19.825 bn
+1.263 bn
6.8%
1 ene 2004 año
24.386 bn
+4.561 bn
23.01%
1 ene 2005 año
30.269 bn
+5.883 bn
24.12%
1 ene 2006 año
48.077 bn
+17.808 bn
58.83%
1 ene 2007 año
79.233 bn
+31.156 bn
64.8%
1 ene 2008 año
103.981 bn
+24.748 bn
31.23%
1 ene 2009 año
117.779 bn
+13.798 bn
13.27%
1 ene 2010 año
103.269 bn
-14.51 bn
-12.32%
1 ene 2011 año
108.171 bn
+4.902 bn
4.75%
1 ene 2012 año
159.405 bn
+51.234 bn
47.36%
1 ene 2013 año
199.084 bn
+39.679 bn
24.89%
1 ene 2014 año
214.59 bn
+15.506 bn
7.79%
1 ene 2015 año
232.976 bn
+18.386 bn
8.57%
1 ene 2016 año
215.748 bn
-17.228 bn
-7.39%
Ranking de los países por los datos estadísticos actuales


Comentarios: