29
/es/
es
AIzaSyAYiBZKx7MnpbEhh9jyipgxe19OcubqV5w
April 1, 2024
225961
Portugal
PRT
true
2
1
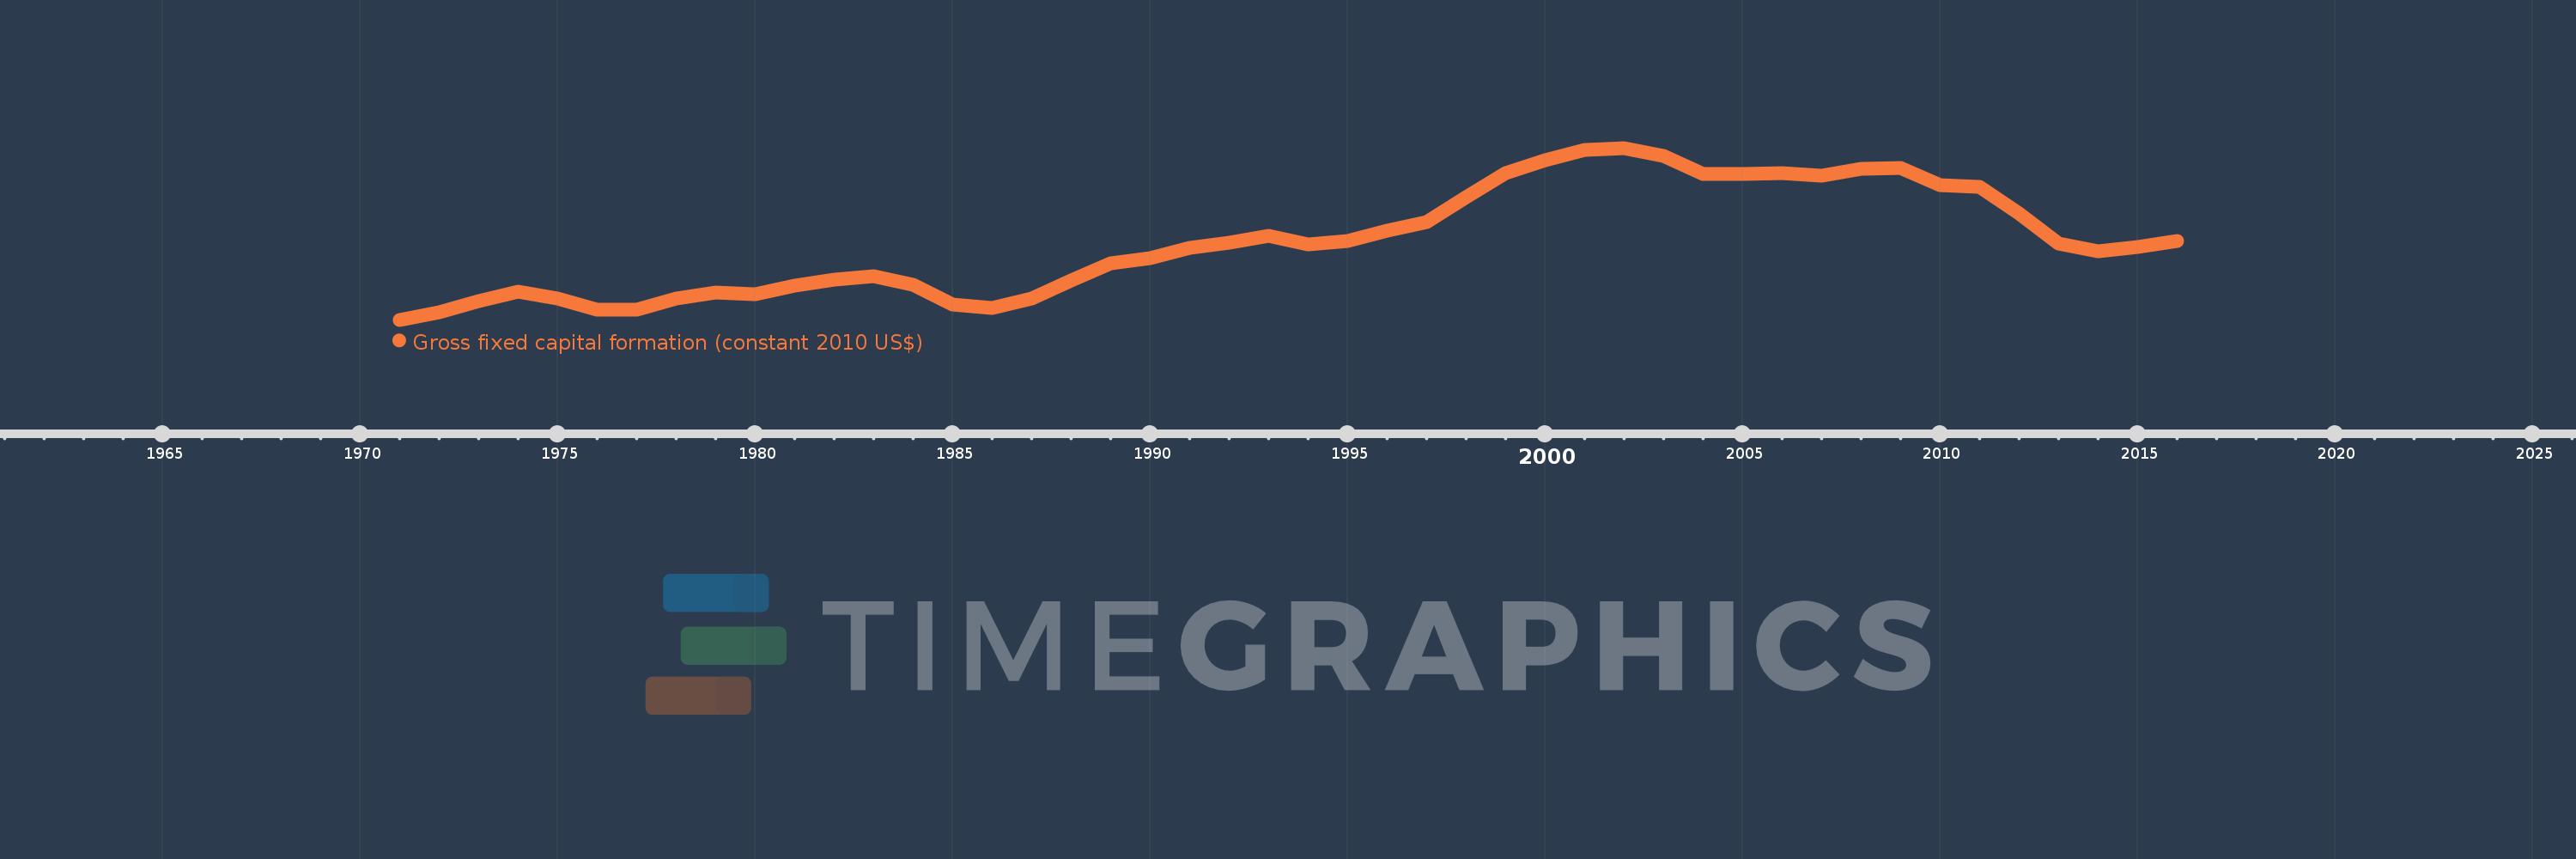
Gross fixed capital formation (constant 2010 US$)
2016,2015,2014,2013,2012,2011,2010,2009,2008,2007,2006,2005,2004,2003,2002,2001,2000,1999,1998,1997,1996,1995,1994,1993,1992,1991,1990,1989,1988,1987,1986,1985,1984,1983,1982,1981,1980,1979,1978,1977,1976,1975,1974,1973,1972,1971
Estas estadísticas en otros países:
AfghanistanAlbaniaAlgeriaAngolaAntigua and BarbudaArab WorldArgentinaArmeniaAustraliaAustriaAzerbaijanBahamas, TheBahrainBangladeshBarbadosBelarusBelgiumBelizeBeninBermudaBhutanBoliviaBosnia and HerzegovinaBotswanaBrazilBrunei DarussalamBulgariaBurkina FasoBurundiCabo VerdeCambodiaCameroonCanadaCaribbean small statesCentral African RepublicCentral Europe and the BalticsChadChileChinaColombiaComorosCongo, Dem. Rep.Congo, Rep.Costa RicaCote d'IvoireCroatiaCubaCyprusCzech RepublicDenmarkDominicaDominican RepublicEarly-demographic dividendEast Asia & PacificEast Asia & Pacific (excluding high income)East Asia & Pacific (IDA & IBRD countries)EcuadorEgypt, Arab Rep.El SalvadorEquatorial GuineaEritreaEstoniaEuro areaEurope & Central AsiaEurope & Central Asia (excluding high income)Europe & Central Asia (IDA & IBRD countries)European UnionFinlandFragile and conflict affected situationsFranceGabonGambia, TheGeorgiaGermanyGhanaGreeceGrenadaGuatemalaGuineaGuinea-BissauGuyanaHaitiHeavily indebted poor countries (HIPC)High incomeHondurasHong Kong SAR, ChinaHungaryIBRD onlyIcelandIDA & IBRD totalIDA blendIDA onlyIDA totalIndiaIndonesiaIran, Islamic Rep.IraqIrelandIsraelItalyJamaicaJapanJordanKazakhstanKenyaKorea, Rep.KosovoKyrgyz RepublicLao PDRLate-demographic dividendLatin America & Caribbean Latin America & Caribbean (excluding high income)Latin America & the Caribbean (IDA & IBRD countries)LatviaLeast developed countries: UN classificationLebanonLiberiaLithuaniaLow & middle incomeLow incomeLower middle incomeLuxembourgMacao SAR, ChinaMacedonia, FYRMadagascarMalawiMalaysiaMaliMaltaMauritaniaMauritiusMexicoMiddle East & North AfricaMiddle East & North Africa (excluding high income)Middle East & North Africa (IDA & IBRD countries)Middle incomeMoldovaMongoliaMontenegroMoroccoMozambiqueNamibiaNepalNetherlandsNew ZealandNicaraguaNigerNigeriaNorth AmericaNorwayOECD membersOmanPakistanPanamaParaguayPeruPhilippinesPolandPortugalPost-demographic dividendPre-demographic dividendPuerto RicoRomaniaRussian FederationRwandaSaudi ArabiaSenegalSerbiaSeychellesSierra LeoneSingaporeSlovak RepublicSloveniaSouth AfricaSouth AsiaSouth Asia (IDA & IBRD)South SudanSpainSri LankaSt. Kitts and NevisSt. LuciaSt. Vincent and the GrenadinesSub-Saharan Africa Sub-Saharan Africa (excluding high income)Sub-Saharan Africa (IDA & IBRD countries)SudanSurinameSwazilandSwedenSwitzerlandTajikistanTanzaniaThailandTimor-LesteTogoTongaTrinidad and TobagoTunisiaTurkeyTurkmenistanUgandaUkraineUnited Arab EmiratesUnited KingdomUnited StatesUpper middle incomeUruguayUzbekistanVanuatuVenezuela, RBVietnamWest Bank and GazaWorldYemen, Rep.ZambiaZimbabwe línea de tiempo (timeline):
En esta escala de tiempo se presenta un gráfico de 1971 y 2016 de Portugal. Los datos de 1970 están ausentes. El número de observaciones reales por fecha: 46.
Fuente (nombre):
Indicadores del desarrollo mundial
Fuente (organización):
World Bank national accounts data, and OECD National Accounts data files.
Categorías:
Economy & Growth
Se ha actualizado:
23 abr 2017 año
Los indicadores de los cambios de valor en los últimos años
Mínimo:
17.942 bn
1 ene 1971 año
Máximo:
58.014 bn
1 ene 2002 año
A la fecha de observación
Valor
Cambio absoluto
El cambio con respecto al valor anterior
1 ene 1971 año
17.942 bn
+17.942 bn
0.0%
1 ene 1972 año
19.704 bn
+1.763 bn
9.83%
1 ene 1973 año
22.366 bn
+2.662 bn
13.51%
1 ene 1974 año
24.497 bn
+2.131 bn
9.53%
1 ene 1975 año
22.793 bn
-1.704 bn
-6.96%
1 ene 1976 año
20.217 bn
-2.576 bn
-11.3%
1 ene 1977 año
20.383 bn
+165.829 millones
0.82%
1 ene 1978 año
22.829 bn
+2.446 bn
12.0%
1 ene 1979 año
24.248 bn
+1.419 bn
6.21%
1 ene 1980 año
23.922 bn
-325.999 millones
-1.34%
1 ene 1981 año
25.964 bn
+2.042 bn
8.54%
1 ene 1982 año
27.392 bn
+1.429 bn
5.5%
1 ene 1983 año
28.011 bn
+618.368 millones
2.26%
1 ene 1984 año
26.013 bn
-1.998 bn
-7.13%
1 ene 1985 año
21.49 bn
-4.523 bn
-17.39%
1 ene 1986 año
20.728 bn
-762.258 millones
-3.55%
1 ene 1987 año
22.981 bn
+2.253 bn
10.87%
1 ene 1988 año
27.117 bn
+4.136 bn
18.0%
1 ene 1989 año
31.14 bn
+4.022 bn
14.83%
1 ene 1990 año
32.279 bn
+1.139 bn
3.66%
1 ene 1991 año
34.734 bn
+2.455 bn
7.61%
1 ene 1992 año
35.89 bn
+1.156 bn
3.33%
1 ene 1993 año
37.514 bn
+1.624 bn
4.52%
1 ene 1994 año
35.434 bn
-2.079 bn
-5.54%
1 ene 1995 año
36.399 bn
+964.676 millones
2.72%
1 ene 1996 año
38.783 bn
+2.384 bn
6.55%
1 ene 1997 año
40.768 bn
+1.985 bn
5.12%
1 ene 1998 año
46.581 bn
+5.813 bn
14.26%
1 ene 1999 año
52.05 bn
+5.469 bn
11.74%
1 ene 2000 año
55.214 bn
+3.164 bn
6.08%
1 ene 2001 año
57.461 bn
+2.248 bn
4.07%
1 ene 2002 año
58.014 bn
+552.418 millones
0.96%
1 ene 2003 año
56.053 bn
-1.961 bn
-3.38%
1 ene 2004 año
51.953 bn
-4.101 bn
-7.32%
1 ene 2005 año
52.028 bn
+74.931 millones
0.14%
1 ene 2006 año
52.076 bn
+48.769 millones
0.09%
1 ene 2007 año
51.636 bn
-440.588 millones
-0.85%
1 ene 2008 año
53.238 bn
+1.602 bn
3.1%
1 ene 2009 año
53.434 bn
+196.424 millones
0.37%
1 ene 2010 año
49.389 bn
-4.045 bn
-7.57%
1 ene 2011 año
48.924 bn
-464.729 millones
-0.94%
1 ene 2012 año
42.8 bn
-6.124 bn
-12.52%
1 ene 2013 año
35.686 bn
-7.114 bn
-16.62%
1 ene 2014 año
33.882 bn
-1.804 bn
-5.06%
1 ene 2015 año
34.837 bn
+954.717 millones
2.82%
1 ene 2016 año
36.276 bn
+1.439 bn
4.13%
Ranking de los países por los datos estadísticos actuales


Comentarios: