29
/es/
es
AIzaSyAYiBZKx7MnpbEhh9jyipgxe19OcubqV5w
April 1, 2024
225818
Portugal
PRT
true
2
1
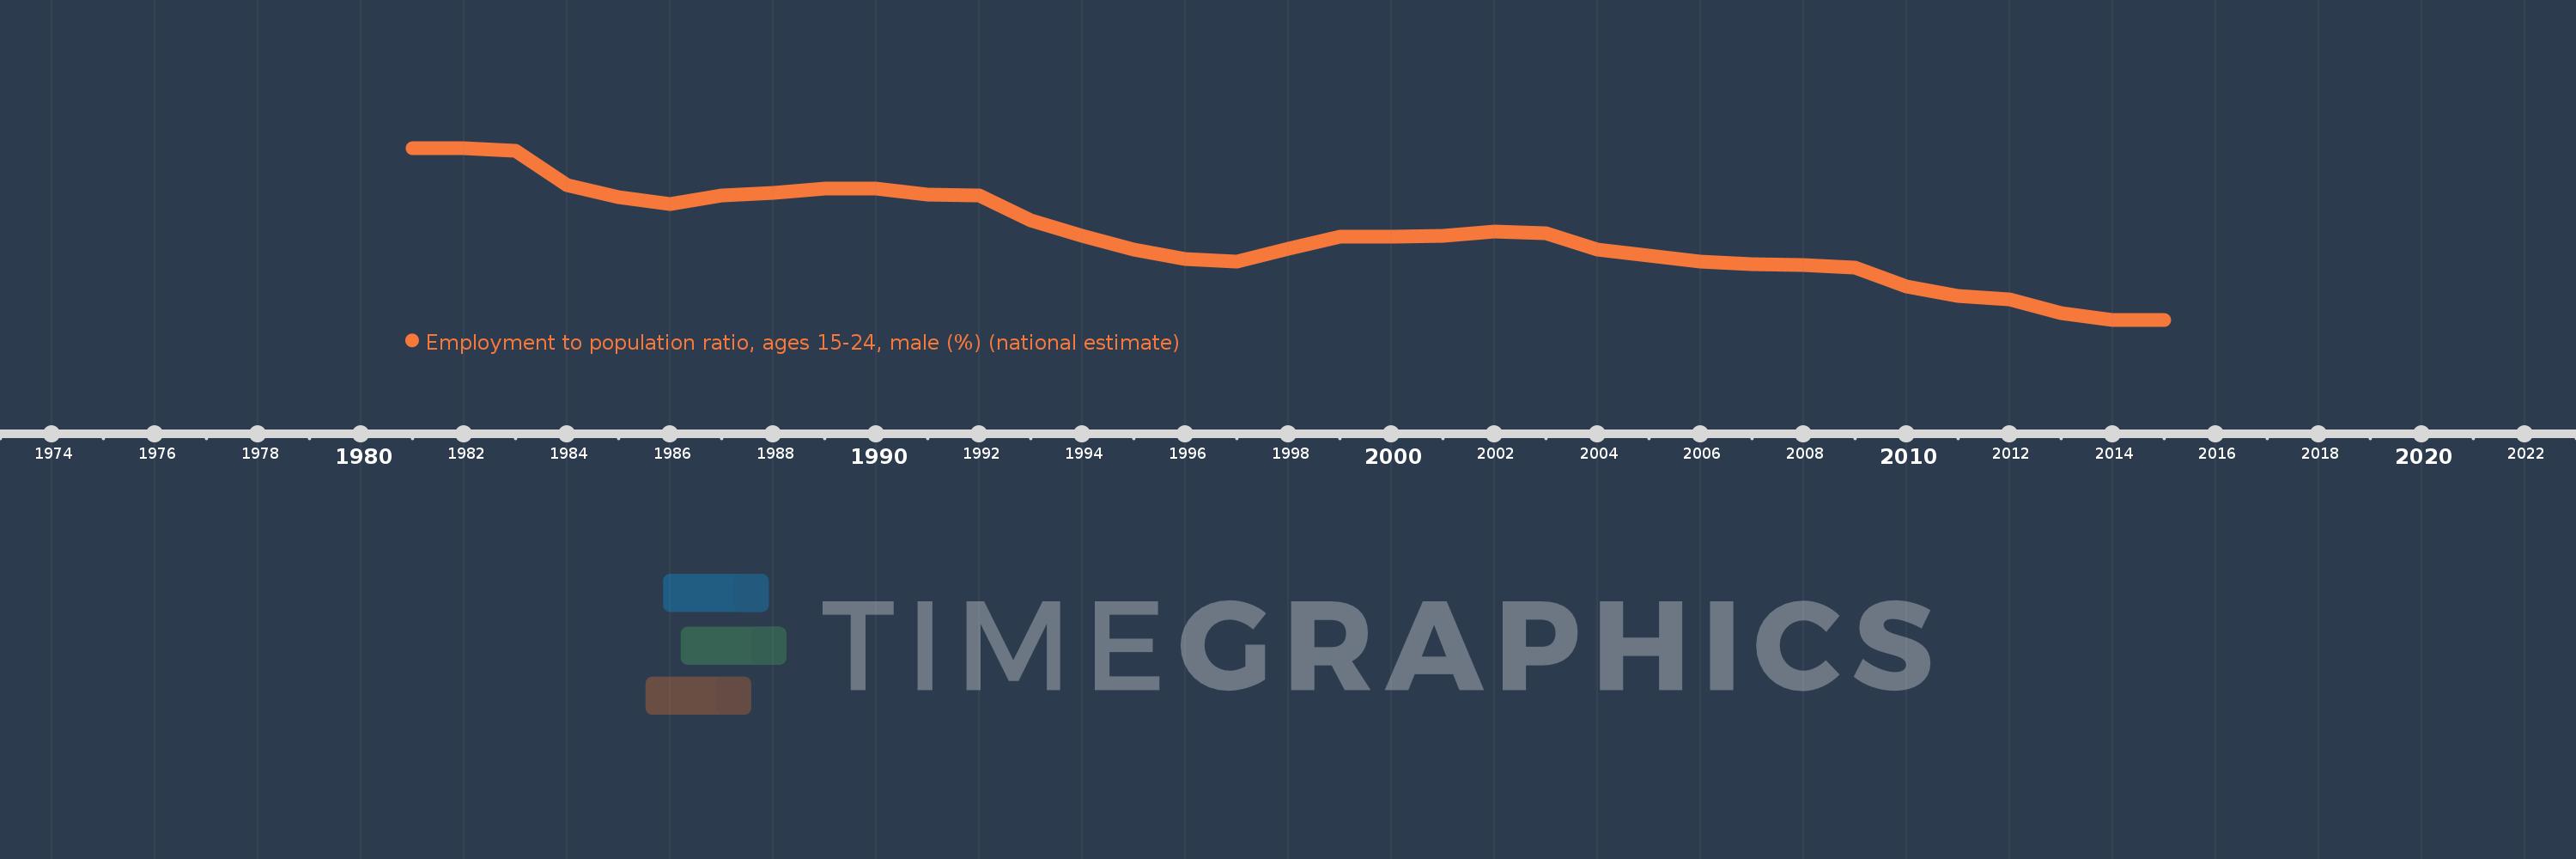
Employment to population ratio, ages 15-24, male (%) (national estimate)
2015,2014,2013,2012,2011,2010,2009,2008,2007,2006,2005,2004,2003,2002,2001,2000,1999,1998,1997,1996,1995,1994,1993,1992,1991,1990,1989,1988,1987,1986,1985,1984,1983,1982,1981
Estas estadísticas en otros países:
línea de tiempo (timeline):
En esta escala de tiempo se presenta un gráfico de 1981 y 2015 de Portugal. Los datos de 1980 están ausentes. El número de observaciones reales por fecha: 35.
Fuente (nombre):
Indicadores del desarrollo mundial
Fuente (organización):
International Labour Organization, Key Indicators of the Labour Market database.
Categorías:
Social Protection & Labor
Se ha actualizado:
23 abr 2017 año
Los indicadores de los cambios de valor en los últimos años
Mínimo:
22.9
1 ene 2014 año
Máximo:
71.9
1 ene 1981 año
A la fecha de observación
Valor
Cambio absoluto
El cambio con respecto al valor anterior
1 ene 1981 año
71.9
+71.9
0.0%
1 ene 1982 año
71.8
-0.1
-0.14%
1 ene 1983 año
71.1
-0.7
-0.97%
1 ene 1984 año
61.4
-9.7
-13.64%
1 ene 1985 año
57.9
-3.5
-5.7%
1 ene 1986 año
55.9
-2.0
-3.45%
1 ene 1987 año
58.3
+2.4
4.29%
1 ene 1988 año
59.0
+0.7
1.2%
1 ene 1989 año
60.3
+1.3
2.2%
1 ene 1990 año
60.4
+0.1
0.17%
1 ene 1991 año
58.7
-1.7
-2.81%
1 ene 1992 año
58.4
-0.3
-0.51%
1 ene 1993 año
51.3
-7.1
-12.16%
1 ene 1994 año
46.8
-4.5
-8.77%
1 ene 1995 año
42.8
-4.0
-8.55%
1 ene 1996 año
40.1
-2.7
-6.31%
1 ene 1997 año
39.4
-0.7
-1.75%
1 ene 1998 año
43.1
+3.7
9.39%
1 ene 1999 año
46.5
+3.4
7.89%
1 ene 2000 año
46.6
+0.1
0.22%
1 ene 2001 año
46.9
+0.3
0.64%
1 ene 2002 año
48.1
+1.2
2.56%
1 ene 2003 año
47.6
-0.5
-1.04%
1 ene 2004 año
43.0
-4.6
-9.66%
1 ene 2005 año
41.2
-1.8
-4.19%
1 ene 2006 año
39.6
-1.6
-3.88%
1 ene 2007 año
38.7
-0.9
-2.27%
1 ene 2008 año
38.5
-0.2
-0.52%
1 ene 2009 año
37.7
-0.8
-2.08%
1 ene 2010 año
32.5
-5.2
-13.79%
1 ene 2011 año
29.7
-2.8
-8.62%
1 ene 2012 año
28.7
-1.0
-3.37%
1 ene 2013 año
24.8
-3.9
-13.59%
1 ene 2014 año
22.9
-1.9
-7.66%
1 ene 2015 año
22.9
0.0
0.0%
Ranking de los países por los datos estadísticos actuales


Comentarios: