29
/es/
es
AIzaSyAYiBZKx7MnpbEhh9jyipgxe19OcubqV5w
April 1, 2024
225122
Poland
POL
true
2
1
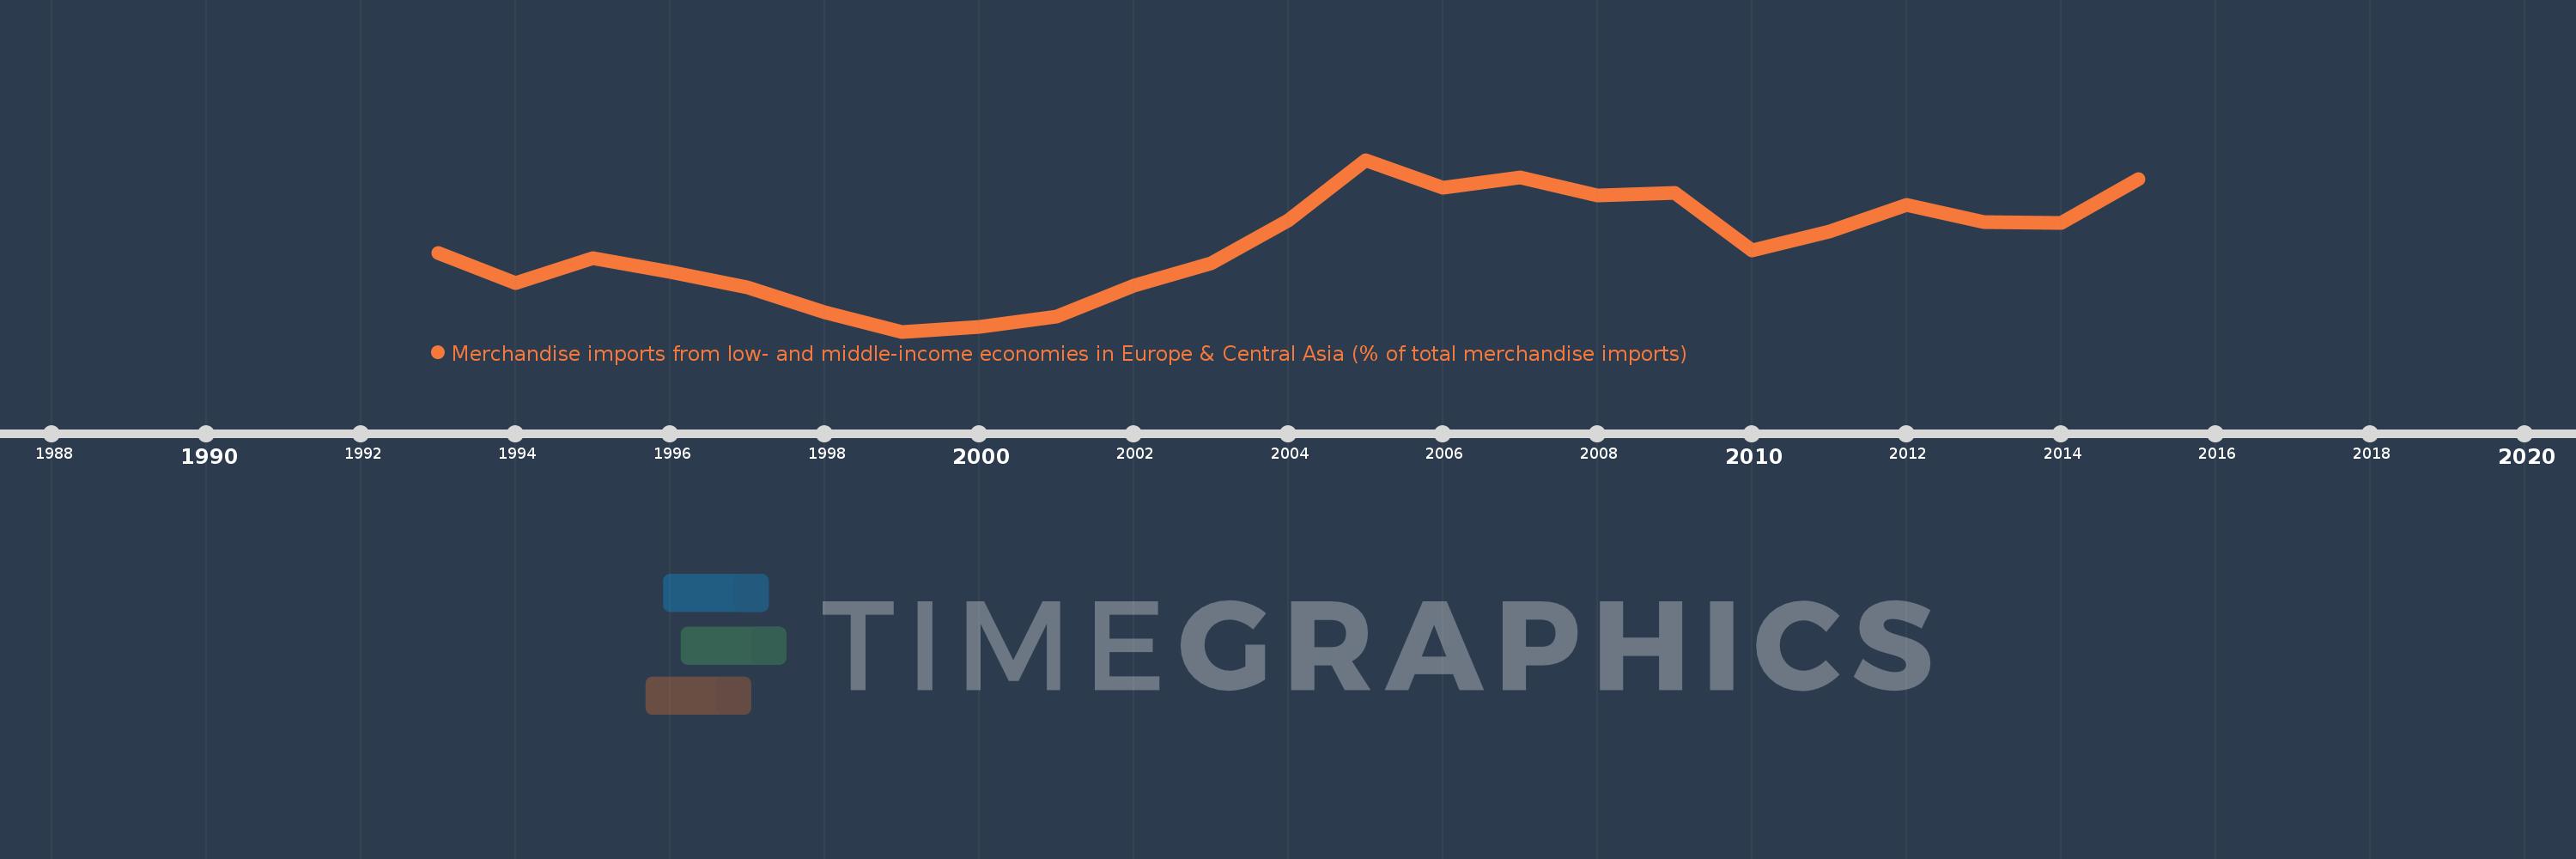
Merchandise imports from low- and middle-income economies in Europe & Central Asia (% of total merchandise imports)
2015,2014,2013,2012,2011,2010,2009,2008,2007,2006,2005,2004,2003,2002,2001,2000,1999,1998,1997,1996,1995,1994,1993
Estas estadísticas en otros países:
AfghanistanAlbaniaAlgeriaArab WorldArgentinaArmeniaArubaAustraliaAustriaAzerbaijanBahamas, TheBahrainBangladeshBarbadosBelarusBelgiumBeninBoliviaBosnia and HerzegovinaBrazilBulgariaCameroonCanadaCaribbean small statesCentral Europe and the BalticsChileChinaColombiaCongo, Rep.Costa RicaCote d'IvoireCroatiaCubaCyprusCzech RepublicDenmarkEarly-demographic dividendEast Asia & PacificEast Asia & Pacific (excluding high income)East Asia & Pacific (IDA & IBRD countries)EcuadorEgypt, Arab Rep.El SalvadorEstoniaEthiopiaEuro areaEurope & Central AsiaEurope & Central Asia (excluding high income)Europe & Central Asia (IDA & IBRD countries)European UnionFinlandFragile and conflict affected situationsFranceGeorgiaGermanyGhanaGibraltarGreeceGreenlandGuatemalaGuineaHeavily indebted poor countries (HIPC)High incomeHondurasHong Kong SAR, ChinaHungaryIBRD onlyIcelandIDA & IBRD totalIDA blendIDA onlyIDA totalIndiaIndonesiaIran, Islamic Rep.IraqIrelandIsraelItalyJamaicaJapanJordanKazakhstanKenyaKorea, Dem. People’s Rep.Korea, Rep.KuwaitKyrgyz RepublicLate-demographic dividendLatin America & Caribbean Latin America & Caribbean (excluding high income)Latin America & the Caribbean (IDA & IBRD countries)LatviaLeast developed countries: UN classificationLebanonLiberiaLibyaLithuaniaLow & middle incomeLow incomeLower middle incomeLuxembourgMacao SAR, ChinaMacedonia, FYRMadagascarMalaysiaMaltaMauritaniaMauritiusMiddle East & North AfricaMiddle East & North Africa (excluding high income)Middle East & North Africa (IDA & IBRD countries)Middle incomeMoldovaMongoliaMontenegroMoroccoNetherlandsNew CaledoniaNew ZealandNigeriaNorth AmericaNorwayOECD membersOmanOther small statesPacific island small statesPakistanPanamaPeruPhilippinesPolandPortugalPost-demographic dividendPre-demographic dividendQatarRomaniaRussian FederationRwandaSaudi ArabiaSenegalSerbiaSingaporeSlovak RepublicSloveniaSmall statesSouth AfricaSouth AsiaSouth Asia (IDA & IBRD)SpainSri LankaSt. Kitts and NevisSub-Saharan Africa Sub-Saharan Africa (excluding high income)Sub-Saharan Africa (IDA & IBRD countries)SwedenSwitzerlandSyrian Arab RepublicTajikistanTanzaniaThailandTogoTongaTrinidad and TobagoTunisiaTurkeyTurkmenistanUgandaUkraineUnited Arab EmiratesUnited KingdomUnited StatesUpper middle incomeUruguayUzbekistanVenezuela, RBVietnamWorldYemen, Rep.ZambiaZimbabwe línea de tiempo (timeline):
En esta escala de tiempo se presenta un gráfico de 1993 y 2015 de Poland. Los datos de 1992 están ausentes. El número de observaciones reales por fecha: 23.
Fuente (nombre):
Indicadores del desarrollo mundial
Fuente (organización):
World Bank staff estimates based data from International Monetary Fund's Direction of Trade database.
Categorías:
Private Sector, Trade
Se ha actualizado:
23 abr 2017 año
Los indicadores de los cambios de valor en los últimos años
Mínimo:
2.164
1 ene 1999 año
Máximo:
4.624
1 ene 2005 año
A la fecha de observación
Valor
Cambio absoluto
El cambio con respecto al valor anterior
1 ene 1993 año
3.286
+3.286
0.0%
1 ene 1994 año
2.858
-0.429
-13.05%
1 ene 1995 año
3.213
+0.356
12.45%
1 ene 1996 año
3.016
-0.197
-6.14%
1 ene 1997 año
2.795
-0.222
-7.35%
1 ene 1998 año
2.441
-0.353
-12.65%
1 ene 1999 año
2.164
-0.277
-11.35%
1 ene 2000 año
2.227
+0.063
2.93%
1 ene 2001 año
2.374
+0.146
6.57%
1 ene 2002 año
2.819
+0.445
18.74%
1 ene 2003 año
3.147
+0.329
11.67%
1 ene 2004 año
3.761
+0.613
19.48%
1 ene 2005 año
4.624
+0.863
22.96%
1 ene 2006 año
4.221
-0.403
-8.72%
1 ene 2007 año
4.372
+0.151
3.57%
1 ene 2008 año
4.115
-0.257
-5.87%
1 ene 2009 año
4.15
+0.035
0.84%
1 ene 2010 año
3.331
-0.818
-19.72%
1 ene 2011 año
3.598
+0.267
8.0%
1 ene 2012 año
3.982
+0.384
10.67%
1 ene 2013 año
3.733
-0.249
-6.24%
1 ene 2014 año
3.717
-0.016
-0.43%
1 ene 2015 año
4.353
+0.636
17.12%
Ranking de los países por los datos estadísticos actuales


Comentarios: