29
/es/
es
AIzaSyAYiBZKx7MnpbEhh9jyipgxe19OcubqV5w
April 1, 2024
224927
Poland
POL
true
2
1
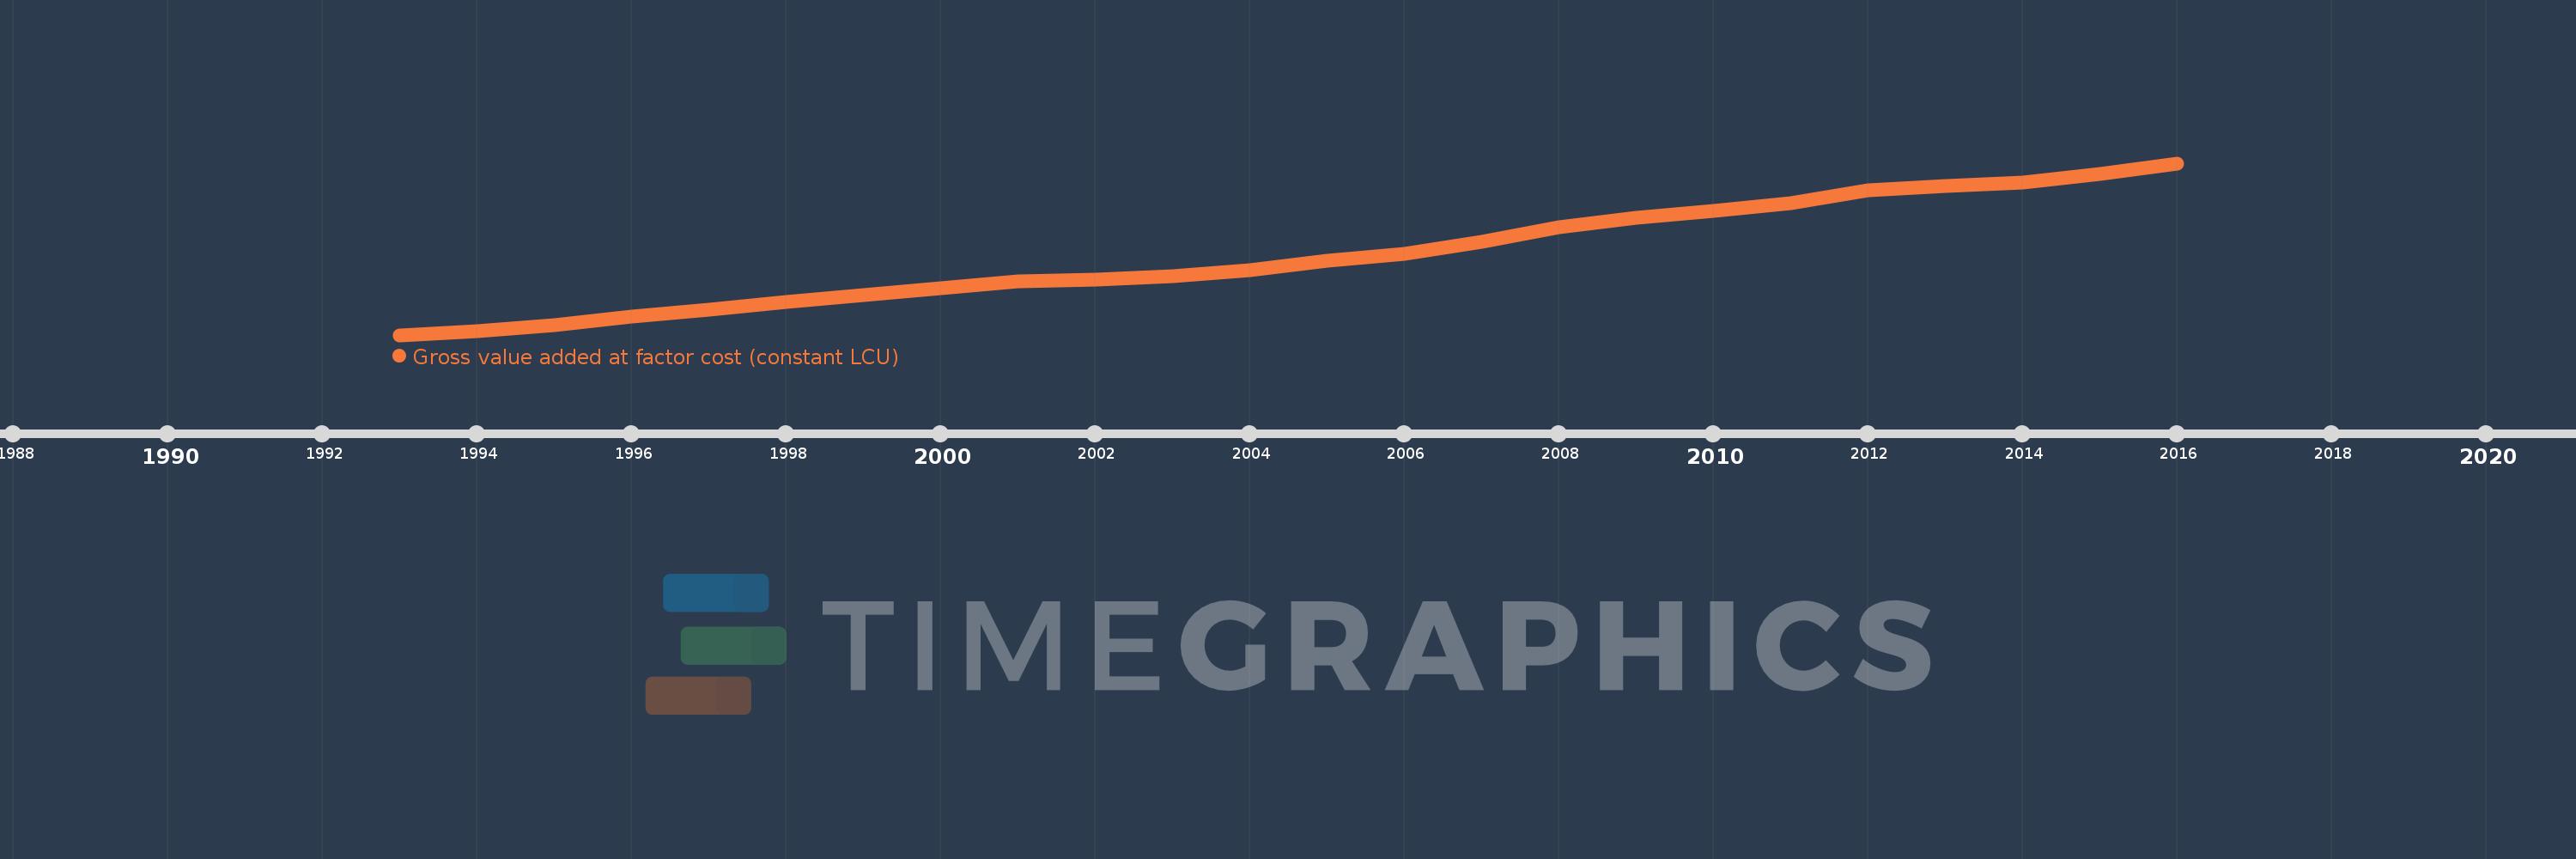
Gross value added at factor cost (constant LCU)
2016,2015,2014,2013,2012,2011,2010,2009,2008,2007,2006,2005,2004,2003,2002,2001,2000,1999,1998,1997,1996,1995,1994,1993
Estas estadísticas en otros países:
AfghanistanAlbaniaAlgeriaAntigua and BarbudaArgentinaArmeniaAustraliaAustriaAzerbaijanBahamas, TheBangladeshBelarusBelgiumBelizeBeninBermudaBhutanBoliviaBosnia and HerzegovinaBotswanaBrazilBulgariaBurkina FasoBurundiCabo VerdeCambodiaCameroonCanadaCayman IslandsCentral African RepublicChadChileColombiaCongo, Dem. Rep.Costa RicaCote d'IvoireCroatiaCubaCyprusCzech RepublicDenmarkDjiboutiDominicaDominican RepublicEcuadorEgypt, Arab Rep.El SalvadorEquatorial GuineaEritreaEstoniaEthiopiaFijiFinlandFranceGabonGambia, TheGeorgiaGermanyGhanaGreeceGrenadaGuatemalaGuineaGuinea-BissauGuyanaHaitiHondurasHong Kong SAR, ChinaHungaryIcelandIndiaIndonesiaIran, Islamic Rep.IrelandItalyJamaicaJapanJordanKazakhstanKenyaKiribatiKorea, Rep.KosovoKuwaitKyrgyz RepublicLao PDRLatviaLebanonLesothoLiberiaLithuaniaLuxembourgMacedonia, FYRMadagascarMalawiMaldivesMaliMarshall IslandsMauritaniaMauritiusMexicoMicronesia, Fed. Sts.MoldovaMongoliaMontenegroMoroccoMozambiqueNamibiaNepalNetherlandsNew ZealandNicaraguaNigeriaNorwayOmanPakistanPalauPanamaPapua New GuineaParaguayPeruPhilippinesPolandPortugalRomaniaRussian FederationRwandaSao Tome and PrincipeSenegalSerbiaSeychellesSierra LeoneSingaporeSlovak RepublicSloveniaSolomon IslandsSomaliaSouth AfricaSpainSri LankaSt. Kitts and NevisSt. LuciaSt. Vincent and the GrenadinesSudanSurinameSwazilandSwedenSwitzerlandSyrian Arab RepublicTajikistanTanzaniaThailandTimor-LesteTongaTrinidad and TobagoTunisiaTurkeyTurkmenistanTuvaluUgandaUkraineUnited Arab EmiratesUnited KingdomUnited StatesUruguayUzbekistanVanuatuVenezuela, RBVietnamWest Bank and GazaZambiaZimbabwe línea de tiempo (timeline):
En esta escala de tiempo se presenta un gráfico de 1993 y 2016 de Poland. Los datos de 1992 están ausentes. El número de observaciones reales por fecha: 24.
Fuente (nombre):
Indicadores del desarrollo mundial
Fuente (organización):
World Bank national accounts data, and OECD National Accounts data files.
Categorías:
Economy & Growth
Se ha actualizado:
23 abr 2017 año
Los indicadores de los cambios de valor en los últimos años
En promedio:
1.001 billones
Mínimo:
587.629 bn
1 ene 1993 año
Máximo:
1.476 billones
1 ene 2016 año
A la fecha de observación
Valor
Cambio absoluto
El cambio con respecto al valor anterior
1 ene 1993 año
587.629 bn
+587.629 bn
0.0%
1 ene 1994 año
608.737 bn
+21.108 bn
3.59%
1 ene 1995 año
638.016 bn
+29.279 bn
4.81%
1 ene 1996 año
680.914 bn
+42.898 bn
6.72%
1 ene 1997 año
718.422 bn
+37.508 bn
5.51%
1 ene 1998 año
760.129 bn
+41.707 bn
5.81%
1 ene 1999 año
793.799 bn
+33.67 bn
4.43%
1 ene 2000 año
828.727 bn
+34.928 bn
4.4%
1 ene 2001 año
864.478 bn
+35.751 bn
4.31%
1 ene 2002 año
876.136 bn
+11.658 bn
1.35%
1 ene 2003 año
893.282 bn
+17.146 bn
1.96%
1 ene 2004 año
923.428 bn
+30.146 bn
3.37%
1 ene 2005 año
973.961 bn
+50.533 bn
5.47%
1 ene 2006 año
1.007 billones
+32.706 bn
3.36%
1 ene 2007 año
1.069 billones
+61.94 bn
6.15%
1 ene 2008 año
1.144 billones
+75.707 bn
7.08%
1 ene 2009 año
1.192 billones
+47.696 bn
4.17%
1 ene 2010 año
1.229 billones
+36.872 bn
3.09%
1 ene 2011 año
1.271 billones
+42.592 bn
3.47%
1 ene 2012 año
1.335 billones
+63.58 bn
5.0%
1 ene 2013 año
1.357 billones
+22.31 bn
1.67%
1 ene 2014 año
1.377 billones
+20.006 bn
1.47%
1 ene 2015 año
1.422 billones
+45.001 bn
3.27%
1 ene 2016 año
1.476 billones
+53.588 bn
3.77%
Ranking de los países por los datos estadísticos actuales


Comentarios: