29
/es/
es
AIzaSyAYiBZKx7MnpbEhh9jyipgxe19OcubqV5w
April 1, 2024
224558
Poland
POL
true
2
1
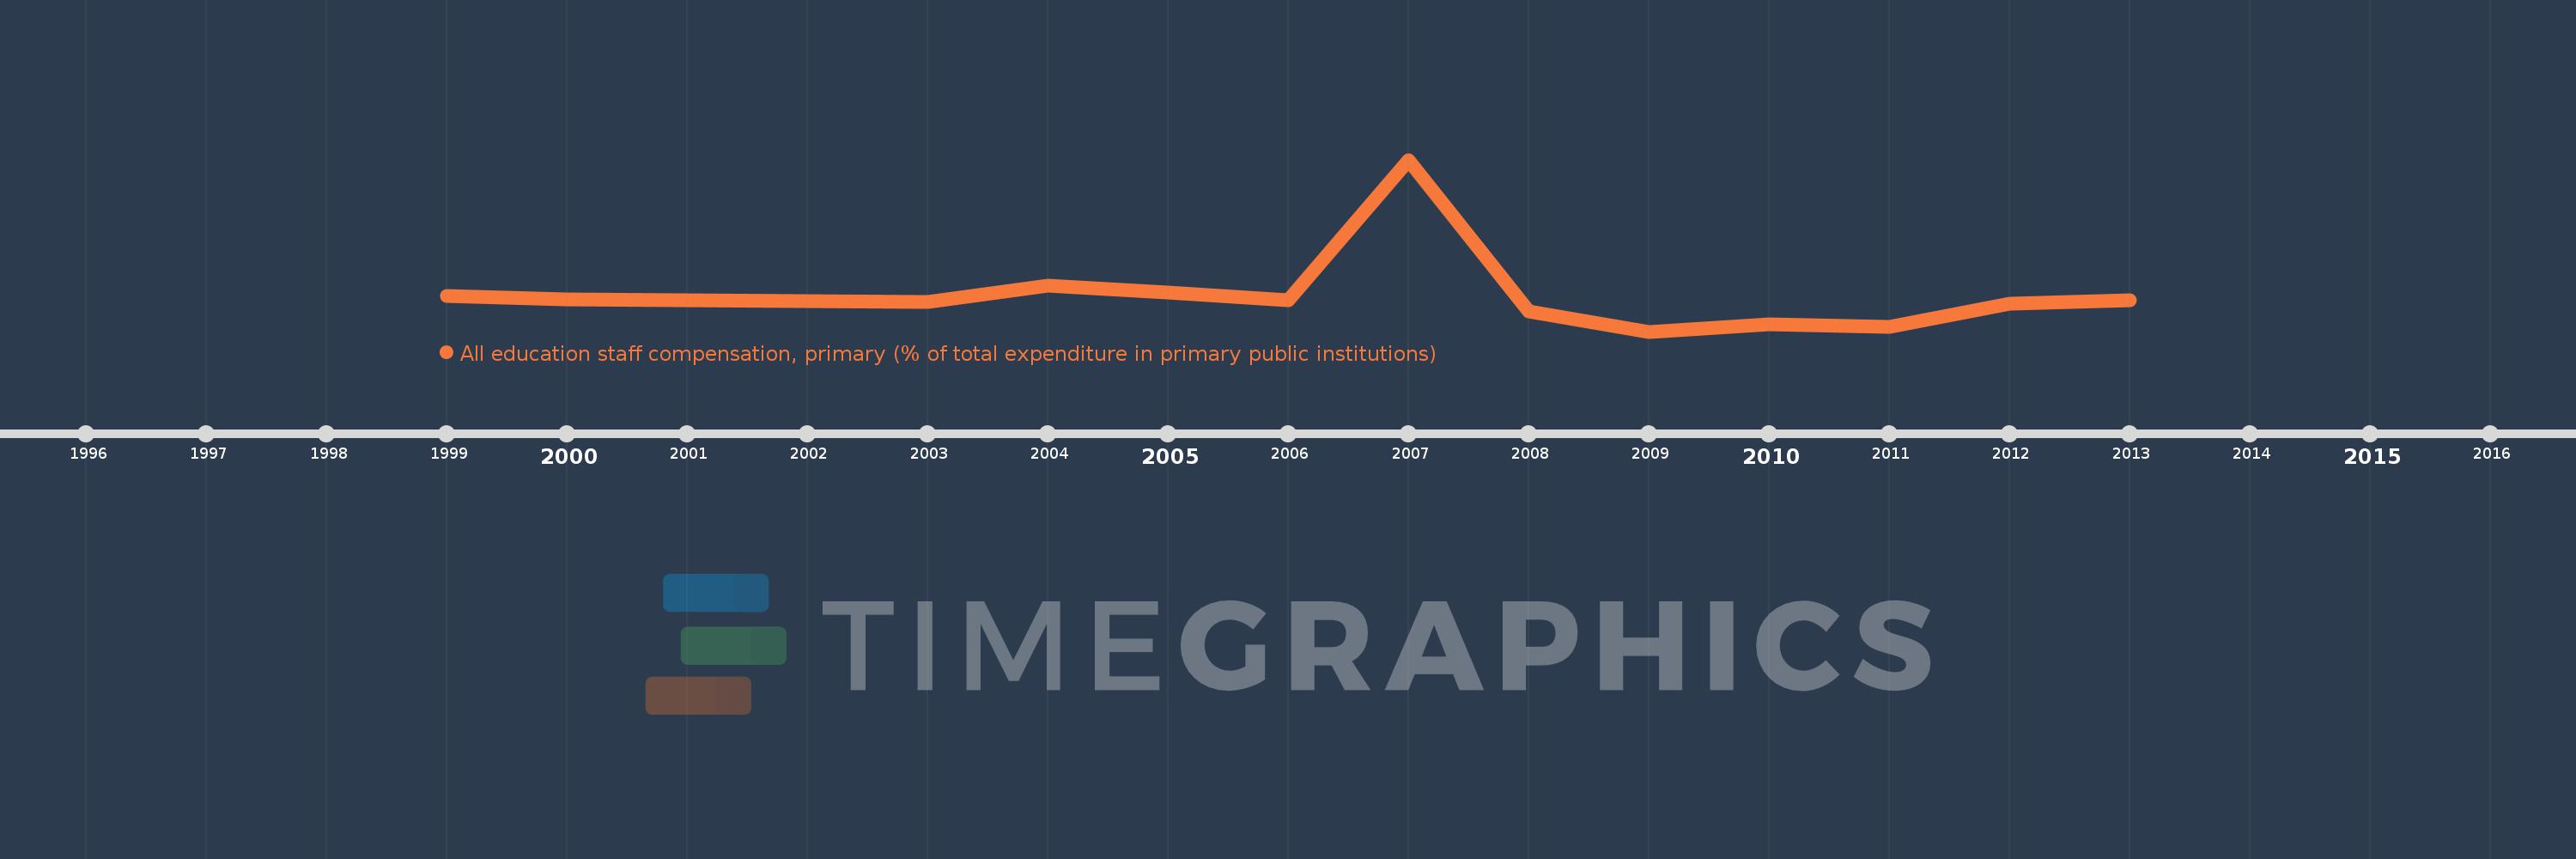
All education staff compensation, primary (% of total expenditure in primary public institutions)
2013,2012,2011,2010,2009,2008,2007,2006,2005,2004,2003,2000,1999
Estas estadísticas en otros países:
línea de tiempo (timeline):
En esta escala de tiempo se presenta un gráfico de 1999 y 2013 de Poland. Los datos de 1998 están ausentes. El número de observaciones reales por fecha: 13.
Fuente (nombre):
Indicadores del desarrollo mundial
Fuente (organización):
United Nations Educational, Scientific, and Cultural Organization (UNESCO) Institute for Statistics.
Categorías:
Education
Se ha actualizado:
23 abr 2017 año
Los indicadores de los cambios de valor en los últimos años
Mínimo:
63.575
1 ene 2009 año
Máximo:
88.892
1 ene 2007 año
A la fecha de observación
Valor
Cambio absoluto
El cambio con respecto al valor anterior
1 ene 1999 año
68.841
+68.841
0.0%
1 ene 2000 año
68.335
-0.506
-0.73%
1 ene 2003 año
67.913
-0.422
-0.62%
1 ene 2004 año
70.325
+2.412
3.55%
1 ene 2005 año
69.337
-0.988
-1.41%
1 ene 2006 año
68.246
-1.092
-1.57%
1 ene 2007 año
88.892
+20.647
30.25%
1 ene 2008 año
66.554
-22.339
-25.13%
1 ene 2009 año
63.575
-2.979
-4.48%
1 ene 2010 año
64.667
+1.092
1.72%
1 ene 2011 año
64.312
-0.355
-0.55%
1 ene 2012 año
67.672
+3.36
5.22%
1 ene 2013 año
68.142
+0.47
0.69%
Ranking de los países por los datos estadísticos actuales


Comentarios: