29
/es/
es
AIzaSyAYiBZKx7MnpbEhh9jyipgxe19OcubqV5w
April 1, 2024
223694
Philippines
PHL
true
2
1
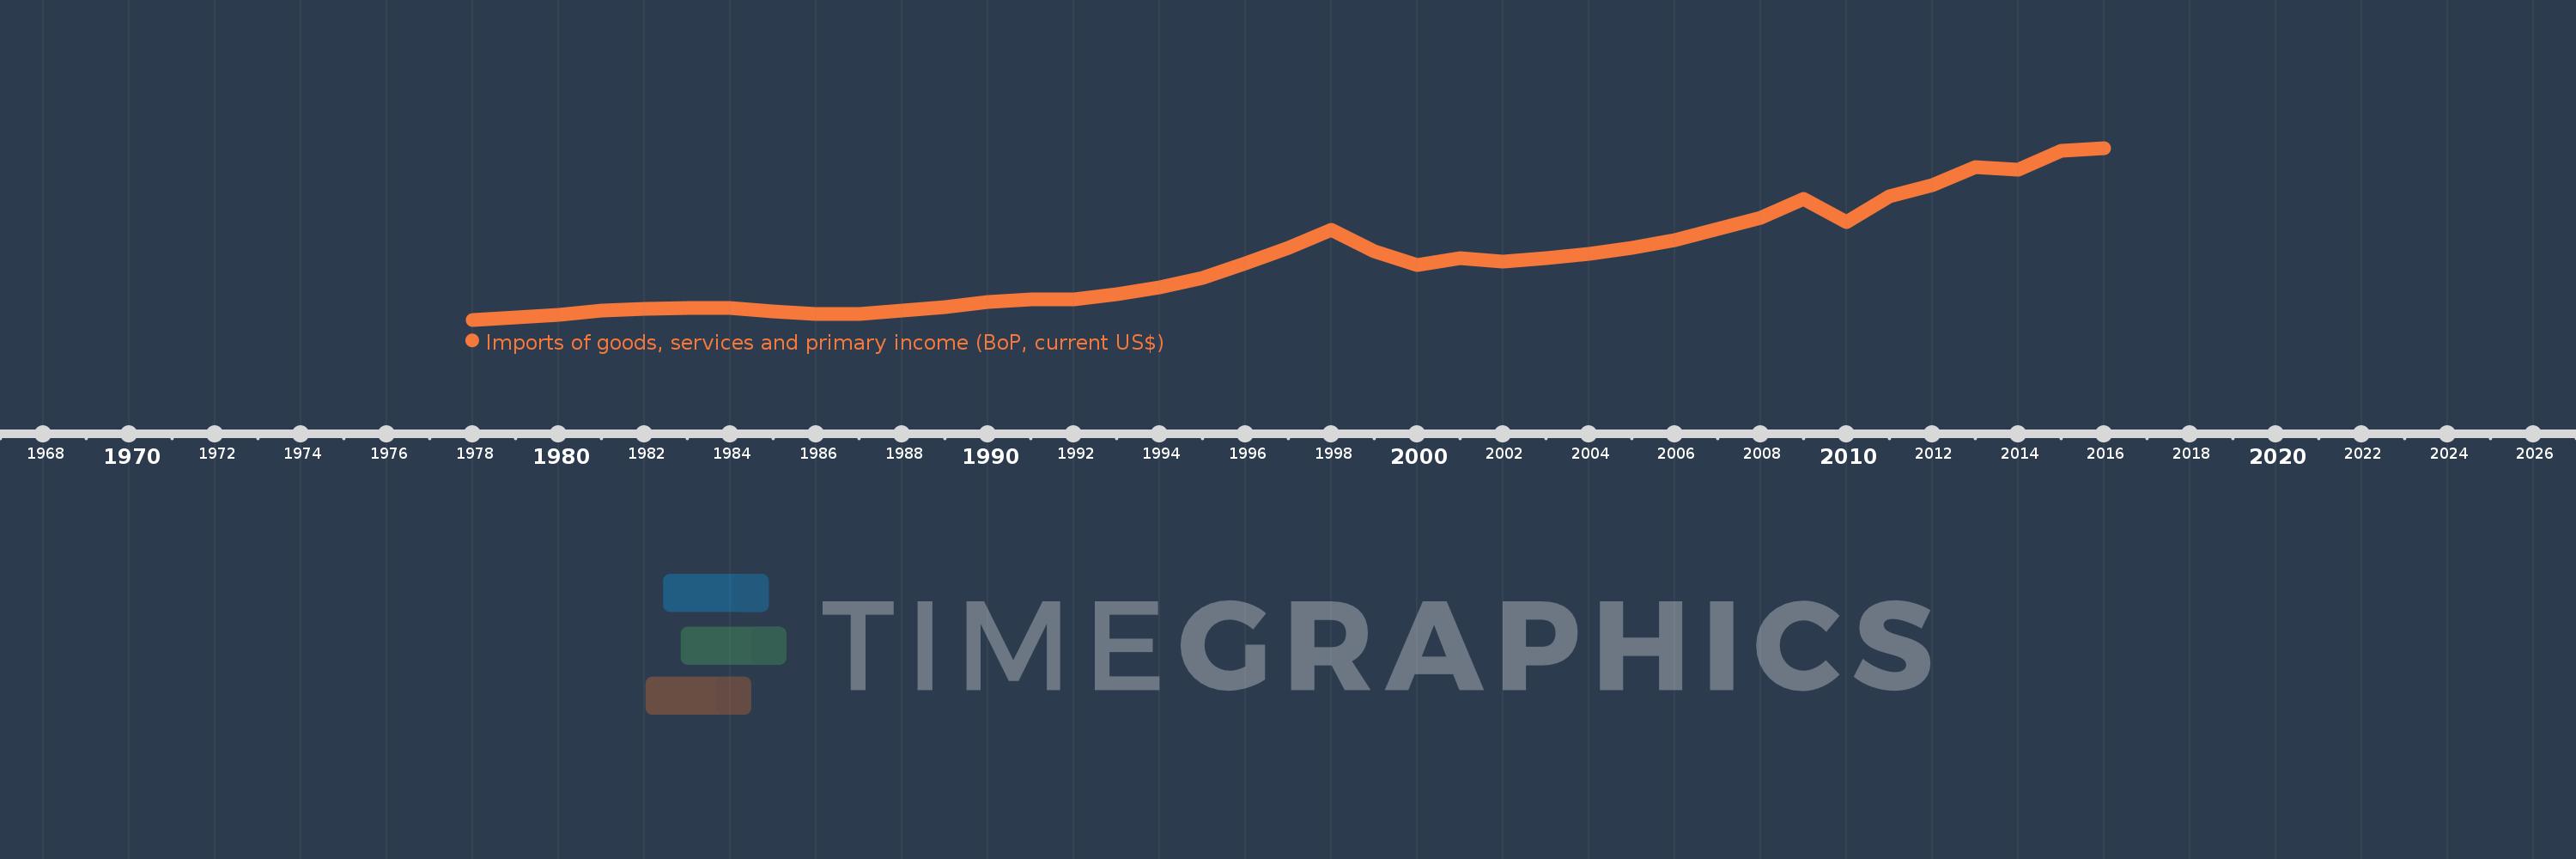
Imports of goods, services and primary income (BoP, current US$)
2016,2015,2014,2013,2012,2011,2010,2009,2008,2007,2006,2005,2004,2003,2002,2001,2000,1999,1998,1997,1996,1995,1994,1993,1992,1991,1990,1989,1988,1987,1986,1985,1984,1983,1982,1981,1980,1979,1978
Estas estadísticas en otros países:
AfghanistanAlbaniaAlgeriaAngolaAntigua and BarbudaArab WorldArgentinaArmeniaArubaAustraliaAustriaAzerbaijanBahamas, TheBahrainBangladeshBarbadosBelarusBelgiumBelizeBeninBermudaBhutanBoliviaBosnia and HerzegovinaBotswanaBrazilBrunei DarussalamBulgariaBurkina FasoBurundiCabo VerdeCambodiaCameroonCanadaCaribbean small statesCentral African RepublicCentral Europe and the BalticsChadChileChinaColombiaComorosCongo, Dem. Rep.Congo, Rep.Costa RicaCote d'IvoireCroatiaCuracaoCyprusCzech RepublicDenmarkDjiboutiDominicaDominican RepublicEarly-demographic dividendEast Asia & PacificEast Asia & Pacific (excluding high income)East Asia & Pacific (IDA & IBRD countries)EcuadorEgypt, Arab Rep.El SalvadorEquatorial GuineaEritreaEstoniaEthiopiaEuro areaEurope & Central AsiaEurope & Central Asia (excluding high income)Europe & Central Asia (IDA & IBRD countries)European UnionFaroe IslandsFijiFinlandFragile and conflict affected situationsFranceFrench PolynesiaGabonGambia, TheGeorgiaGermanyGhanaGreeceGrenadaGuatemalaGuineaGuinea-BissauGuyanaHaitiHeavily indebted poor countries (HIPC)High incomeHondurasHong Kong SAR, ChinaHungaryIBRD onlyIcelandIDA & IBRD totalIDA blendIDA onlyIDA totalIndiaIndonesiaIran, Islamic Rep.IraqIrelandIsraelItalyJamaicaJapanJordanKazakhstanKenyaKiribatiKorea, Rep.KosovoKuwaitKyrgyz RepublicLao PDRLate-demographic dividendLatin America & Caribbean Latin America & Caribbean (excluding high income)Latin America & the Caribbean (IDA & IBRD countries)LatviaLeast developed countries: UN classificationLebanonLesothoLiberiaLibyaLithuaniaLow & middle incomeLow incomeLower middle incomeLuxembourgMacao SAR, ChinaMacedonia, FYRMadagascarMalawiMalaysiaMaldivesMaliMaltaMarshall IslandsMauritaniaMauritiusMexicoMicronesia, Fed. Sts.Middle East & North Africa (excluding high income)Middle East & North Africa (IDA & IBRD countries)Middle incomeMoldovaMongoliaMontenegroMoroccoMozambiqueMyanmarNamibiaNepalNetherlandsNew CaledoniaNicaraguaNigerNigeriaNorth AmericaNorwayOECD membersOmanOther small statesPacific island small statesPakistanPalauPanamaPapua New GuineaParaguayPeruPhilippinesPolandPortugalPost-demographic dividendPre-demographic dividendQatarRomaniaRussian FederationRwandaSamoaSao Tome and PrincipeSaudi ArabiaSenegalSerbiaSeychellesSierra LeoneSingaporeSint Maarten (Dutch part)Slovak RepublicSloveniaSmall statesSolomon IslandsSouth AfricaSouth AsiaSouth Asia (IDA & IBRD)South SudanSpainSri LankaSt. Kitts and NevisSt. LuciaSt. Vincent and the GrenadinesSub-Saharan Africa Sub-Saharan Africa (excluding high income)Sub-Saharan Africa (IDA & IBRD countries)SudanSurinameSwazilandSwedenSwitzerlandSyrian Arab RepublicTajikistanTanzaniaThailandTimor-LesteTogoTongaTrinidad and TobagoTunisiaTurkeyTuvaluUgandaUkraineUnited KingdomUnited StatesUpper middle incomeUruguayVanuatuVenezuela, RBVietnamWest Bank and GazaWorldYemen, Rep.ZambiaZimbabwe línea de tiempo (timeline):
En esta escala de tiempo se presenta un gráfico de 1978 y 2016 de Philippines. Los datos de 1977 están ausentes. El número de observaciones reales por fecha: 39.
Fuente (nombre):
Indicadores del desarrollo mundial
Fuente (organización):
International Monetary Fund, Balance of Payments Statistics Yearbook and data files.
Categorías:
Economy & Growth, External Debt, Trade
Se ha actualizado:
23 abr 2017 año
Los indicadores de los cambios de valor en los últimos años
Mínimo:
5.248 bn
1 ene 1978 año
Máximo:
97.837 bn
1 ene 2016 año
A la fecha de observación
Valor
Cambio absoluto
El cambio con respecto al valor anterior
1 ene 1978 año
5.248 bn
+5.248 bn
0.0%
1 ene 1979 año
6.322 bn
+1.074 bn
20.46%
1 ene 1980 año
8.106 bn
+1.784 bn
28.22%
1 ene 1981 año
10.348 bn
+2.242 bn
27.66%
1 ene 1982 año
11.151 bn
+803.0 millones
7.76%
1 ene 1983 año
11.69 bn
+539.0 millones
4.83%
1 ene 1984 año
11.375 bn
-315.0 millones
-2.69%
1 ene 1985 año
9.697 bn
-1.678 bn
-14.75%
1 ene 1986 año
8.331 bn
-1.366 bn
-14.09%
1 ene 1987 año
8.12 bn
-211.0 millones
-2.53%
1 ene 1988 año
10.191 bn
+2.071 bn
25.5%
1 ene 1989 año
11.831 bn
+1.64 bn
16.09%
1 ene 1990 año
14.693 bn
+2.862 bn
24.19%
1 ene 1991 año
16.437 bn
+1.744 bn
11.87%
1 ene 1992 año
16.324 bn
-113.0 millones
-0.69%
1 ene 1993 año
19.137 bn
+2.813 bn
17.23%
1 ene 1994 año
22.587 bn
+3.45 bn
18.03%
1 ene 1995 año
27.919 bn
+5.332 bn
23.61%
1 ene 1996 año
35.722 bn
+7.803 bn
27.95%
1 ene 1997 año
44.091 bn
+8.369 bn
23.43%
1 ene 1998 año
53.494 bn
+9.403 bn
21.33%
1 ene 1999 año
42.302 bn
-11.192 bn
-20.92%
1 ene 2000 año
34.961 bn
-7.341 bn
-17.35%
1 ene 2001 año
38.668 bn
+3.707 bn
10.6%
1 ene 2002 año
36.584 bn
-2.084 bn
-5.39%
1 ene 2003 año
38.312 bn
+1.728 bn
4.72%
1 ene 2004 año
40.639 bn
+2.327 bn
6.07%
1 ene 2005 año
43.822 bn
+3.183 bn
7.83%
1 ene 2006 año
48.158 bn
+4.336 bn
9.89%
1 ene 2007 año
54.155 bn
+5.998 bn
12.45%
1 ene 2008 año
60.07 bn
+5.915 bn
10.92%
1 ene 2009 año
70.313 bn
+10.243 bn
17.05%
1 ene 2010 año
57.753 bn
-12.56 bn
-17.86%
1 ene 2011 año
71.658 bn
+13.905 bn
24.08%
1 ene 2012 año
77.716 bn
+6.058 bn
8.45%
1 ene 2013 año
87.631 bn
+9.915 bn
12.76%
1 ene 2014 año
85.896 bn
-1.735 bn
-1.98%
1 ene 2015 año
96.127 bn
+10.232 bn
11.91%
1 ene 2016 año
97.837 bn
+1.71 bn
1.78%
Ranking de los países por los datos estadísticos actuales


Comentarios: