29
/es/
es
AIzaSyAYiBZKx7MnpbEhh9jyipgxe19OcubqV5w
April 1, 2024
223486
Philippines
PHL
true
2
1
Export volume index (2000 = 100)
2016,2015,2014,2013,2012,2011,2010,2009,2008,2007,2006,2005,2004,2003,2002,2001,2000,1999,1998,1997,1996,1995,1994,1993,1992,1991,1990,1989,1988,1987,1986,1985,1984,1983,1982,1981
Estas estadísticas en otros países:
AfghanistanAlbaniaAlgeriaAmerican SamoaAndorraAngolaAntigua and BarbudaArgentinaArmeniaArubaAustraliaAustriaAzerbaijanBahamas, TheBahrainBangladeshBarbadosBelarusBelgiumBelizeBeninBermudaBhutanBoliviaBosnia and HerzegovinaBotswanaBrazilBritish Virgin IslandsBrunei DarussalamBulgariaBurkina FasoBurundiCabo VerdeCambodiaCameroonCanadaCayman IslandsCentral African RepublicChadChileChinaColombiaComorosCongo, Dem. Rep.Congo, Rep.Costa RicaCote d'IvoireCroatiaCubaCuracaoCyprusCzech RepublicDenmarkDjiboutiDominicaDominican RepublicEcuadorEgypt, Arab Rep.El SalvadorEquatorial GuineaEritreaEstoniaEthiopiaFaroe IslandsFijiFinlandFranceFrench PolynesiaGabonGambia, TheGeorgiaGermanyGhanaGibraltarGreeceGreenlandGrenadaGuamGuatemalaGuineaGuinea-BissauGuyanaHaitiHondurasHong Kong SAR, ChinaHungaryIcelandIndiaIndonesiaIran, Islamic Rep.IraqIrelandIsraelItalyJamaicaJapanJordanKazakhstanKenyaKiribatiKorea, Dem. People’s Rep.Korea, Rep.KuwaitKyrgyz RepublicLao PDRLatviaLebanonLesothoLiberiaLibyaLithuaniaLuxembourgMacao SAR, ChinaMacedonia, FYRMadagascarMalawiMalaysiaMaldivesMaliMaltaMarshall IslandsMauritaniaMauritiusMexicoMicronesia, Fed. Sts.MoldovaMongoliaMoroccoMozambiqueMyanmarNamibiaNauruNepalNetherlandsNew CaledoniaNew ZealandNicaraguaNigerNigeriaNorthern Mariana IslandsNorwayOmanPakistanPalauPanamaPapua New GuineaParaguayPeruPhilippinesPolandPortugalQatarRomaniaRussian FederationRwandaSamoaSao Tome and PrincipeSaudi ArabiaSenegalSerbiaSeychellesSierra LeoneSingaporeSlovak RepublicSloveniaSolomon IslandsSomaliaSouth AfricaSpainSri LankaSt. Kitts and NevisSt. LuciaSt. Vincent and the GrenadinesSudanSurinameSwazilandSwedenSwitzerlandSyrian Arab RepublicTajikistanTanzaniaThailandTogoTongaTrinidad and TobagoTunisiaTurkeyTurkmenistanTurks and Caicos IslandsUgandaUkraineUnited Arab EmiratesUnited KingdomUnited StatesUruguayUzbekistanVanuatuVenezuela, RBVietnamWest Bank and GazaYemen, Rep.ZambiaZimbabwe línea de tiempo (timeline):
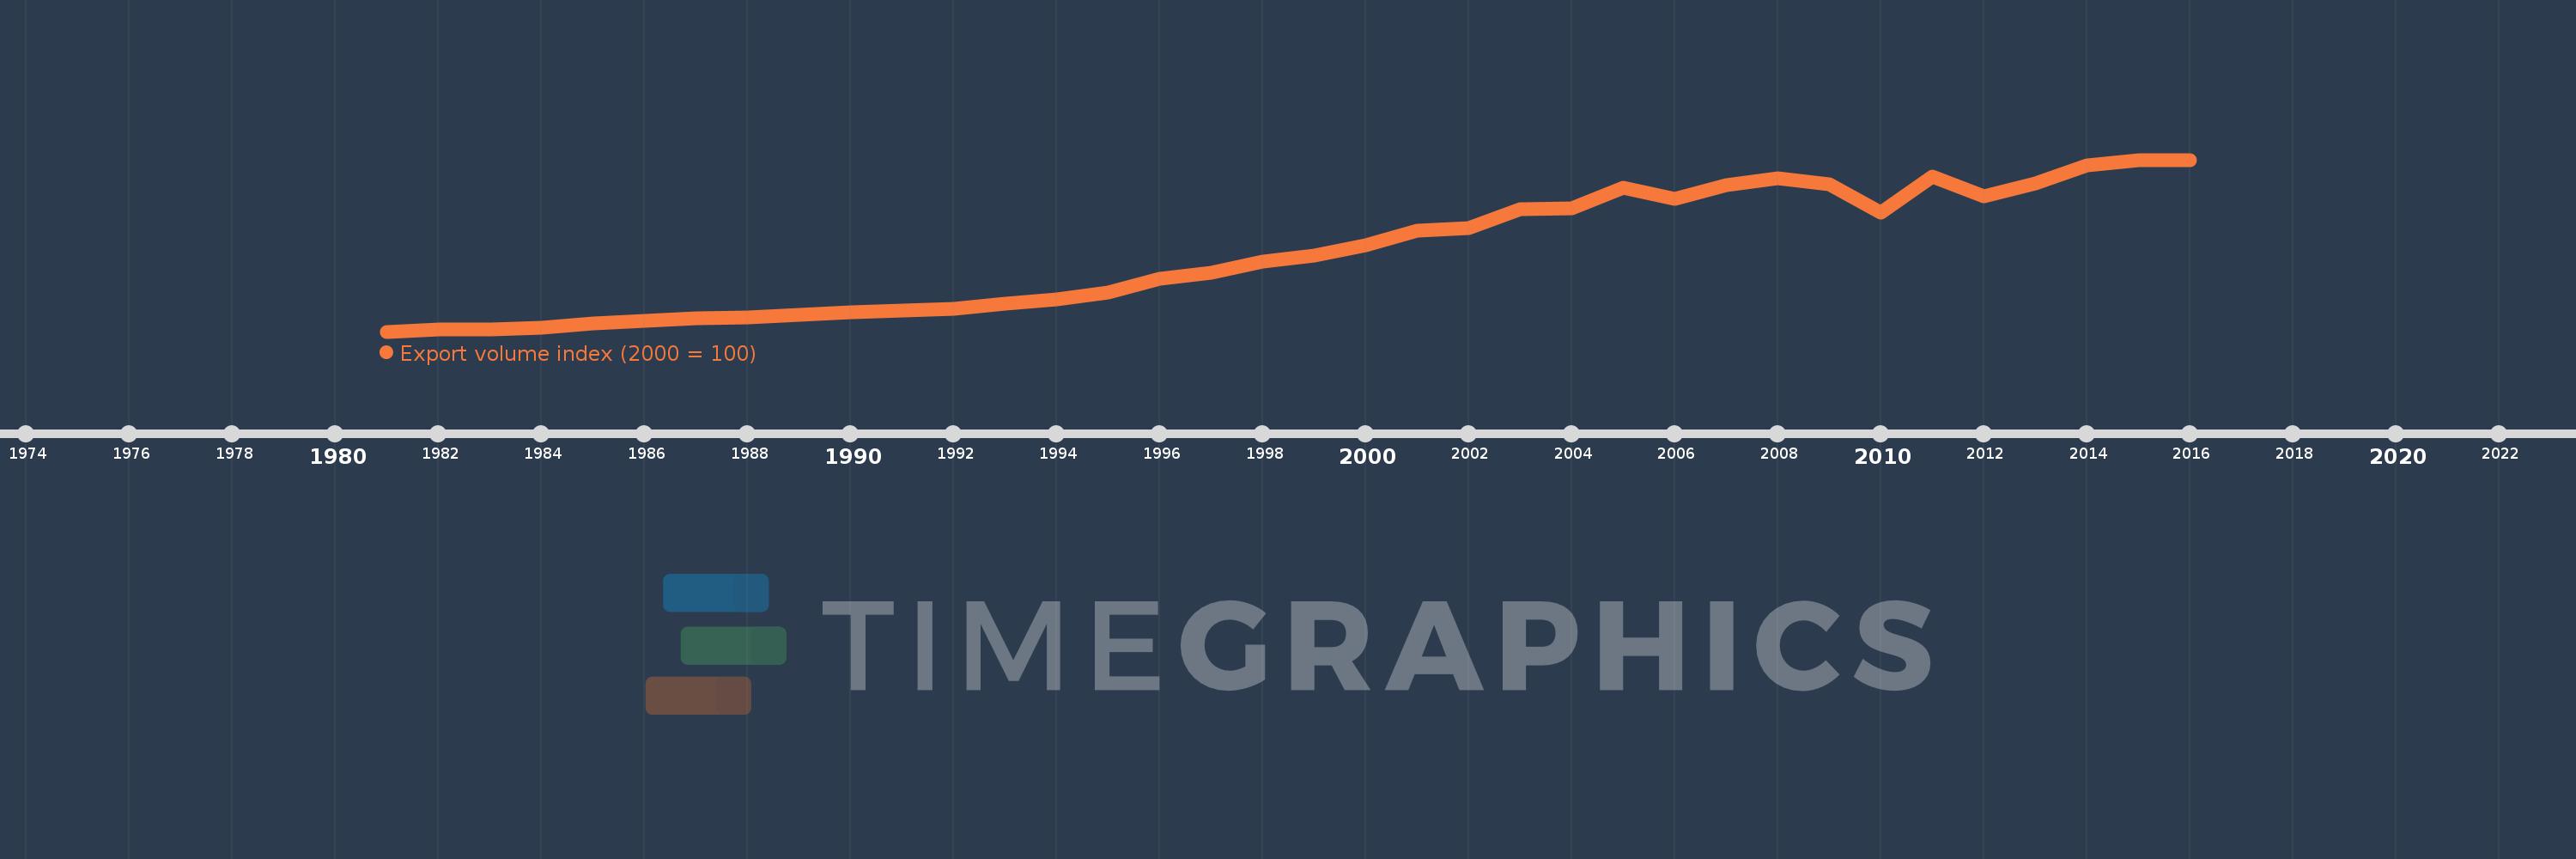
En esta escala de tiempo se presenta un gráfico de 1981 y 2016 de Philippines. Los datos de 1980 están ausentes. El número de observaciones reales por fecha: 36.
Fuente (nombre):
Indicadores del desarrollo mundial
Fuente (organización):
United Nations Conference on Trade and Development, Handbook of Statistics and data files, and International Monetary Fund, International Financial Statistics.
Categorías:
Private Sector, Trade
Se ha actualizado:
23 abr 2017 año
Los indicadores de los cambios de valor en los últimos años
Mínimo:
4.282
1 ene 1981 año
Máximo:
166.771
1 ene 2016 año
A la fecha de observación
Valor
Cambio absoluto
El cambio con respecto al valor anterior
1 ene 1981 año
4.282
+4.282
0.0%
1 ene 1982 año
6.153
+1.871
43.69%
1 ene 1983 año
5.976
-0.177
-2.88%
1 ene 1984 año
7.731
+1.755
29.36%
1 ene 1985 año
12.389
+4.658
60.26%
1 ene 1986 año
14.31
+1.922
15.51%
1 ene 1987 año
16.778
+2.467
17.24%
1 ene 1988 año
18.062
+1.284
7.65%
1 ene 1989 año
20.057
+1.995
11.05%
1 ene 1990 año
22.701
+2.644
13.18%
1 ene 1991 año
24.582
+1.881
8.29%
1 ene 1992 año
26.027
+1.445
5.88%
1 ene 1993 año
30.637
+4.61
17.71%
1 ene 1994 año
34.968
+4.331
14.14%
1 ene 1995 año
41.286
+6.318
18.07%
1 ene 1996 año
54.313
+13.027
31.55%
1 ene 1997 año
59.648
+5.335
9.82%
1 ene 1998 año
70.274
+10.626
17.82%
1 ene 1999 año
76.223
+5.949
8.47%
1 ene 2000 año
85.925
+9.701
12.73%
1 ene 2001 año
100.0
+14.075
16.38%
1 ene 2002 año
101.777
+1.777
1.78%
1 ene 2003 año
120.123
+18.345
18.02%
1 ene 2004 año
121.063
+0.94
0.78%
1 ene 2005 año
140.04
+18.977
15.68%
1 ene 2006 año
130.19
-9.85
-7.03%
1 ene 2007 año
143.115
+12.925
9.93%
1 ene 2008 año
149.489
+6.375
4.45%
1 ene 2009 año
143.454
-6.035
-4.04%
1 ene 2010 año
116.757
-26.697
-18.61%
1 ene 2011 año
150.882
+34.125
29.23%
1 ene 2012 año
132.593
-18.289
-12.12%
1 ene 2013 año
144.602
+12.009
9.06%
1 ene 2014 año
161.336
+16.734
11.57%
1 ene 2015 año
166.013
+4.677
2.9%
1 ene 2016 año
166.771
+0.758
0.46%
Ranking de los países por los datos estadísticos actuales


Comentarios: