29
/es/
es
AIzaSyAYiBZKx7MnpbEhh9jyipgxe19OcubqV5w
April 1, 2024
222621
Peru
PER
true
2
1
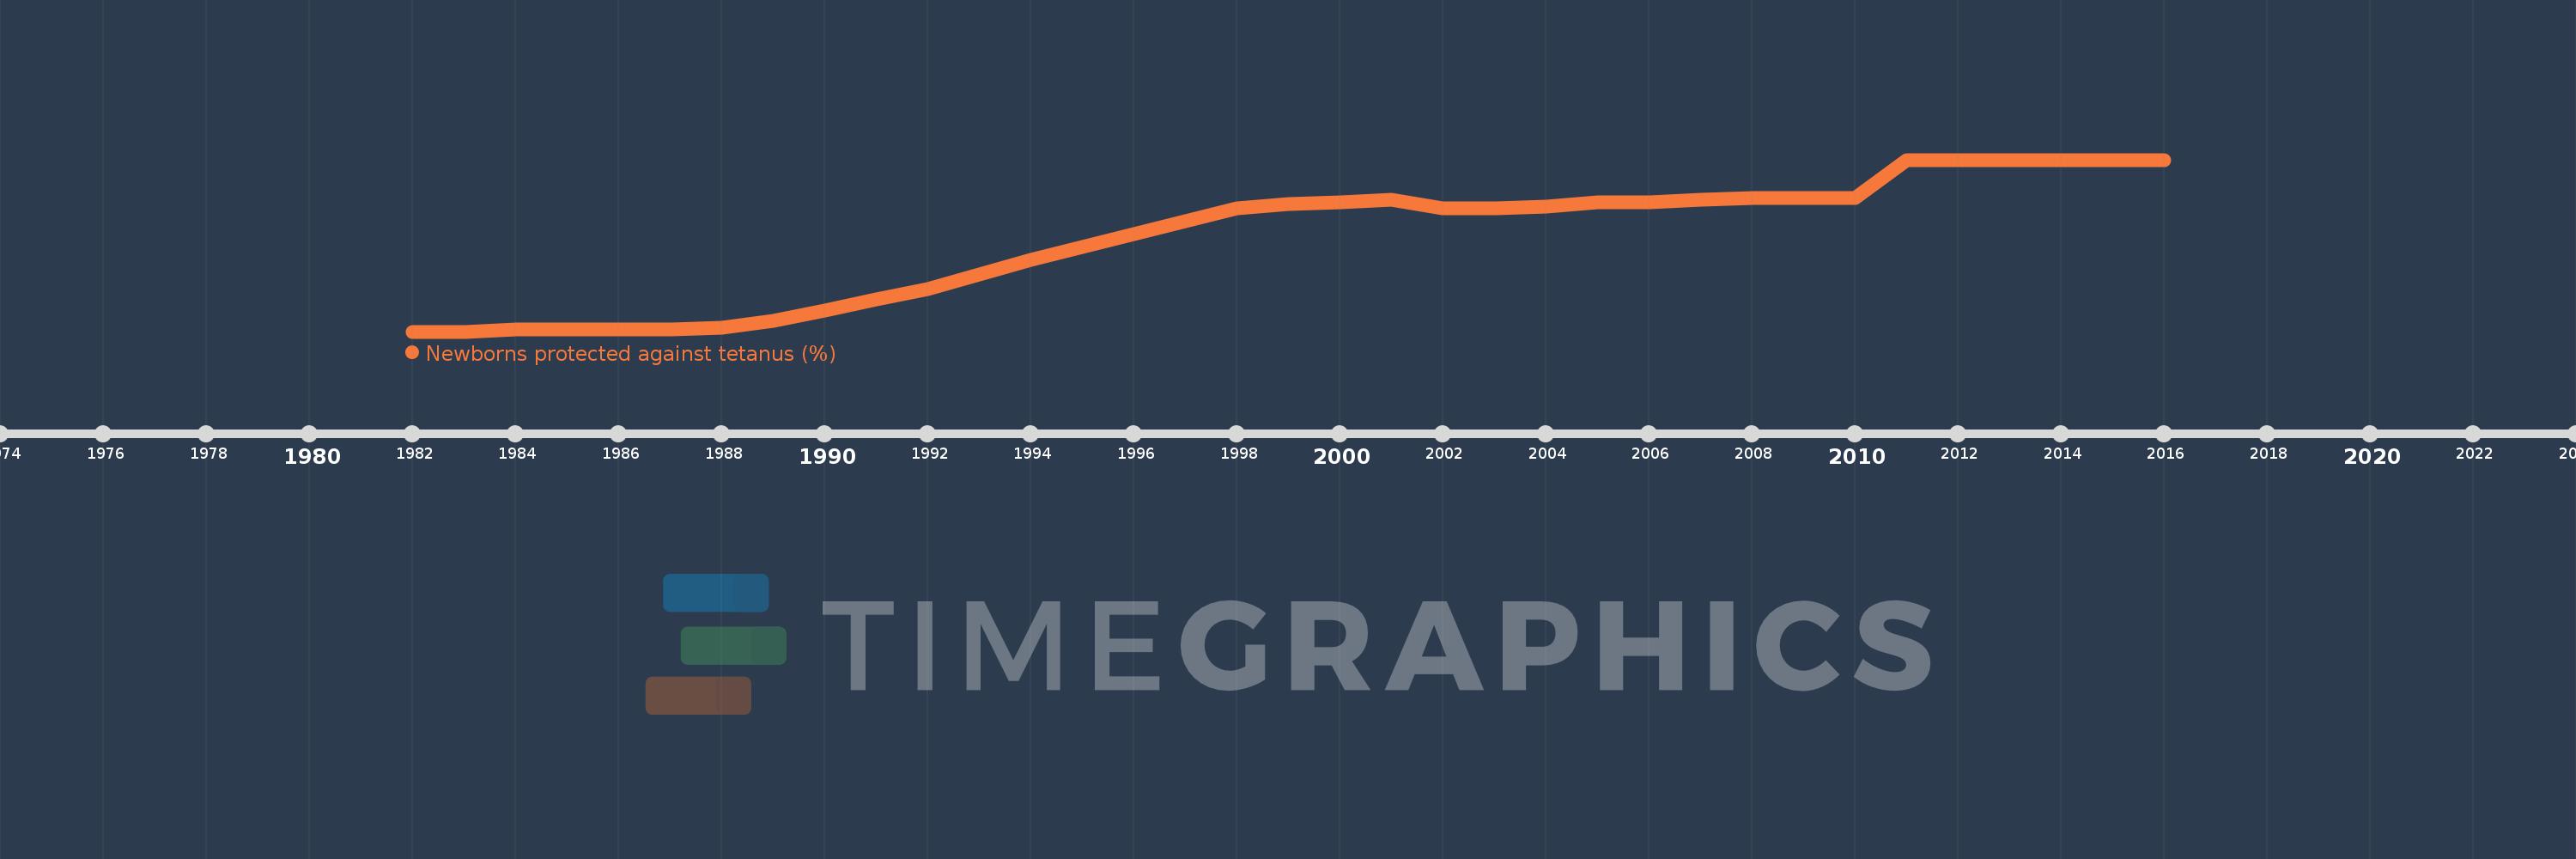
Newborns protected against tetanus (%)
2016,2015,2014,2013,2012,2011,2010,2009,2008,2007,2006,2005,2004,2003,2002,2001,2000,1999,1998,1997,1996,1995,1994,1993,1992,1991,1990,1989,1988,1987,1986,1985,1984,1983,1982
Estas estadísticas en otros países:
línea de tiempo (timeline):
En esta escala de tiempo se presenta un gráfico de 1982 y 2016 de Peru. Los datos de 1981 están ausentes. El número de observaciones reales por fecha: 35.
Fuente (nombre):
Indicadores del desarrollo mundial
Fuente (organización):
WHO and UNICEF (http://www.who.int/immunization/monitoring_surveillance/en/).
Categorías:
Health
Se ha actualizado:
23 abr 2017 año
Los indicadores de los cambios de valor en los últimos años
Máximo:
85.0
1 ene 2011 año
A la fecha de observación
Valor
Cambio absoluto
El cambio con respecto al valor anterior
1 ene 1982 año
4.0
+4.0
0.0%
1 ene 1983 año
4.0
0.0
0.0%
1 ene 1984 año
5.0
+1.0
25.0%
1 ene 1985 año
5.0
0.0
0.0%
1 ene 1986 año
5.0
0.0
0.0%
1 ene 1987 año
5.0
0.0
0.0%
1 ene 1988 año
6.0
+1.0
20.0%
1 ene 1989 año
9.0
+3.0
50.0%
1 ene 1990 año
14.0
+5.0
55.56%
1 ene 1991 año
19.0
+5.0
35.71%
1 ene 1992 año
24.0
+5.0
26.32%
1 ene 1993 año
31.0
+7.0
29.17%
1 ene 1994 año
38.0
+7.0
22.58%
1 ene 1995 año
44.0
+6.0
15.79%
1 ene 1996 año
50.0
+6.0
13.64%
1 ene 1997 año
56.0
+6.0
12.0%
1 ene 1998 año
62.0
+6.0
10.71%
1 ene 1999 año
64.0
+2.0
3.23%
1 ene 2000 año
65.0
+1.0
1.56%
1 ene 2001 año
66.0
+1.0
1.54%
1 ene 2002 año
62.0
-4.0
-6.06%
1 ene 2003 año
62.0
0.0
0.0%
1 ene 2004 año
63.0
+1.0
1.61%
1 ene 2005 año
65.0
+2.0
3.17%
1 ene 2006 año
65.0
0.0
0.0%
1 ene 2007 año
66.0
+1.0
1.54%
1 ene 2008 año
67.0
+1.0
1.52%
1 ene 2009 año
67.0
0.0
0.0%
1 ene 2010 año
67.0
0.0
0.0%
1 ene 2011 año
85.0
+18.0
26.87%
1 ene 2012 año
85.0
0.0
0.0%
1 ene 2013 año
85.0
0.0
0.0%
1 ene 2014 año
85.0
0.0
0.0%
1 ene 2015 año
85.0
0.0
0.0%
1 ene 2016 año
85.0
0.0
0.0%
Ranking de los países por los datos estadísticos actuales


Comentarios: