29
/es/
es
AIzaSyAYiBZKx7MnpbEhh9jyipgxe19OcubqV5w
April 1, 2024
221321
Paraguay
PRY
true
2
1
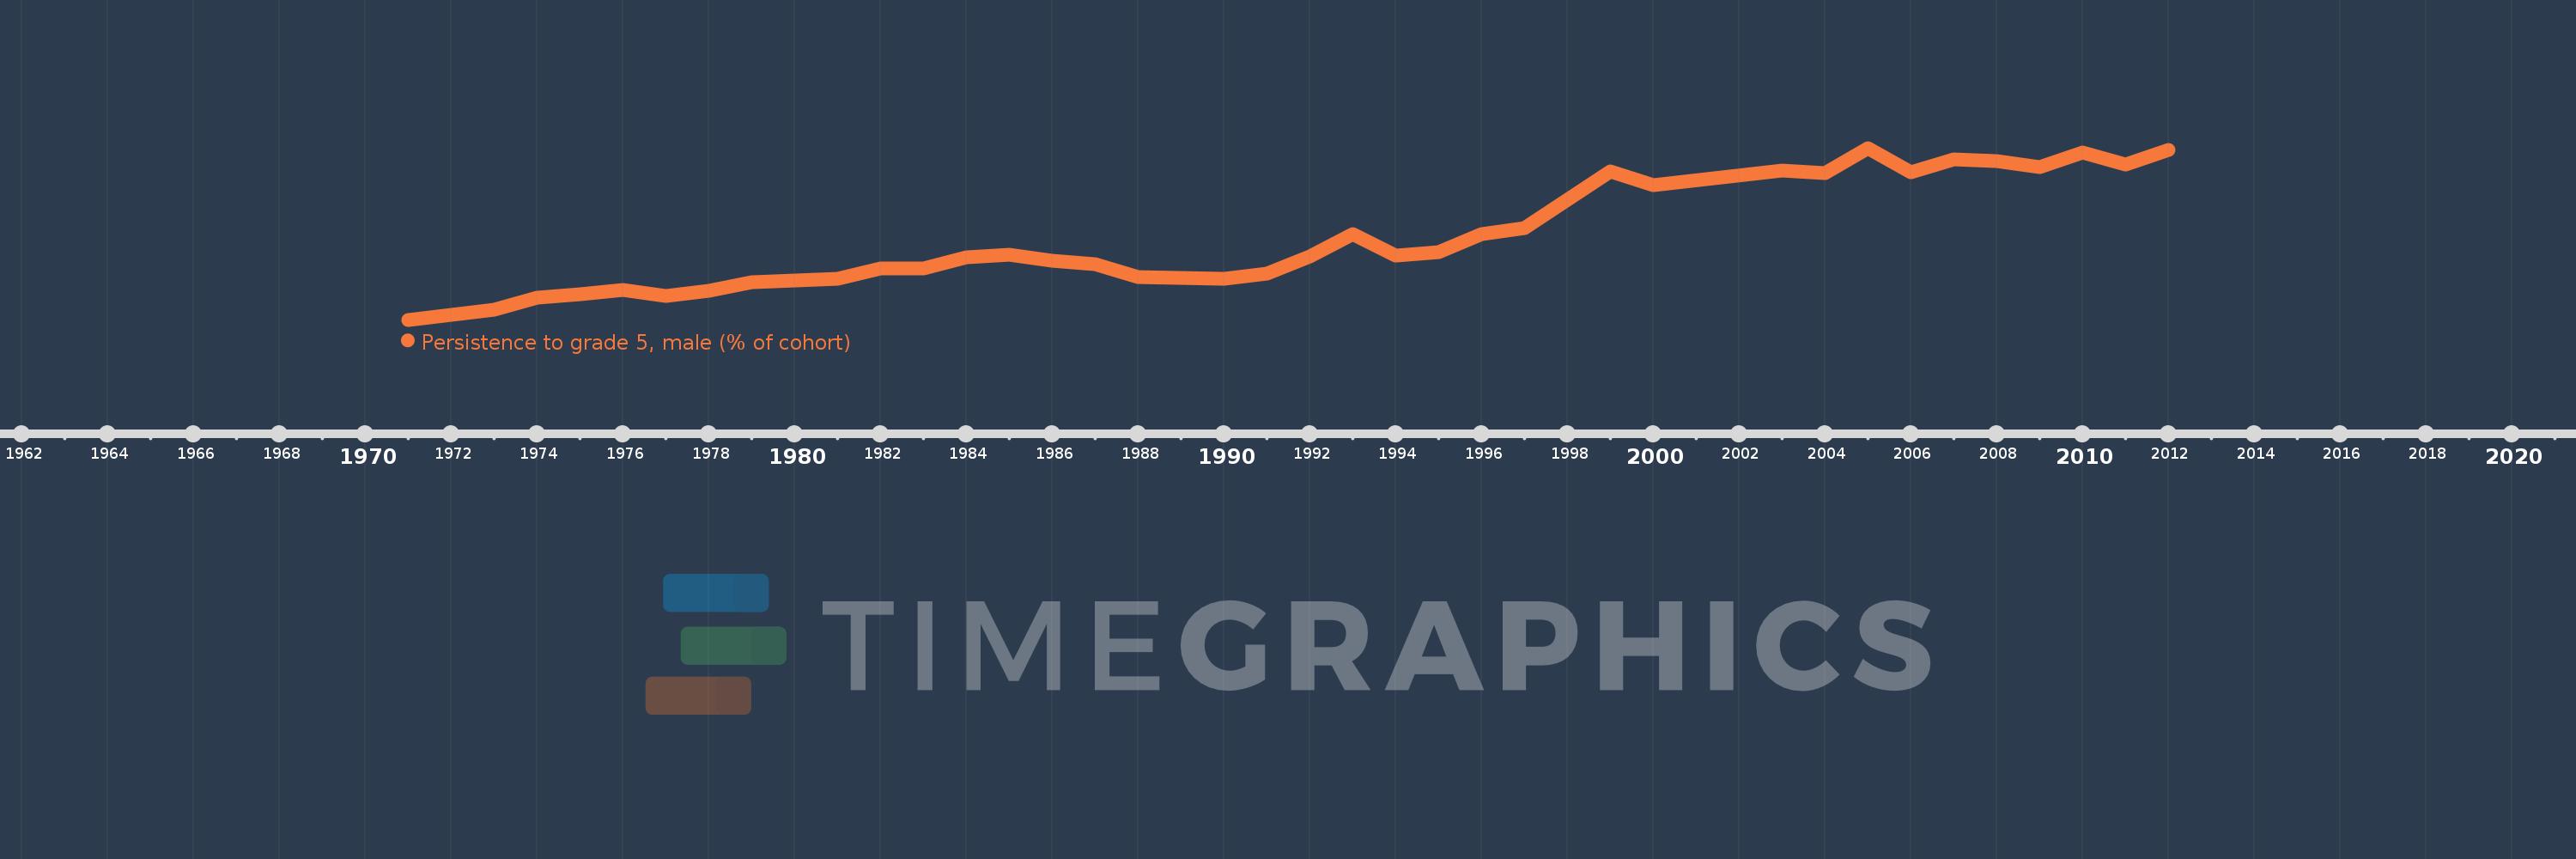
Persistence to grade 5, male (% of cohort)
2012,2011,2010,2009,2008,2007,2006,2005,2004,2003,2000,1999,1997,1996,1995,1994,1993,1992,1991,1990,1989,1988,1987,1986,1985,1984,1983,1982,1981,1979,1978,1977,1976,1975,1974,1973,1971
Estas estadísticas en otros países:
AfghanistanAlbaniaAlgeriaAndorraAngolaAntigua and BarbudaArab WorldArgentinaArubaBahamas, TheBahrainBangladeshBarbadosBelgiumBelizeBeninBermudaBhutanBoliviaBosnia and HerzegovinaBotswanaBrunei DarussalamBurkina FasoBurundiCabo VerdeCambodiaCameroonCanadaCaribbean small statesCayman IslandsCentral African RepublicChadChileChinaColombiaComorosCongo, Dem. Rep.Congo, Rep.Costa RicaCote d'IvoireCubaCyprusCzech RepublicDenmarkDjiboutiDominicaDominican RepublicEarly-demographic dividendEast Asia & PacificEast Asia & Pacific (excluding high income)East Asia & Pacific (IDA & IBRD countries)EcuadorEgypt, Arab Rep.El SalvadorEquatorial GuineaEritreaEstoniaEthiopiaFijiFinlandFranceGabonGambia, TheGeorgiaGhanaGreeceGrenadaGuatemalaGuineaGuinea-BissauGuyanaHaitiHeavily indebted poor countries (HIPC)HondurasHong Kong SAR, ChinaHungaryIcelandIDA blendIDA onlyIDA totalIndiaIndonesiaIran, Islamic Rep.IraqIrelandIsraelItalyJamaicaJapanJordanKenyaKiribatiKorea, Rep.KuwaitLao PDRLate-demographic dividendLatviaLeast developed countries: UN classificationLebanonLesothoLiberiaLibyaLiechtensteinLow incomeLower middle incomeLuxembourgMacao SAR, ChinaMadagascarMalawiMalaysiaMaldivesMaliMaltaMarshall IslandsMauritaniaMauritiusMexicoMiddle East & North AfricaMiddle East & North Africa (excluding high income)Middle East & North Africa (IDA & IBRD countries)MontenegroMoroccoMozambiqueMyanmarNamibiaNepalNetherlandsNicaraguaNigerNigeriaNorwayOmanOther small statesPacific island small statesPakistanPanamaPapua New GuineaParaguayPeruPhilippinesPolandPortugalPre-demographic dividendQatarRwandaSamoaSan MarinoSao Tome and PrincipeSaudi ArabiaSenegalSeychellesSierra LeoneSingaporeSloveniaSolomon IslandsSouth AfricaSouth AsiaSouth Asia (IDA & IBRD)SpainSri LankaSt. Kitts and NevisSt. LuciaSt. Vincent and the GrenadinesSub-Saharan Africa Sub-Saharan Africa (excluding high income)Sub-Saharan Africa (IDA & IBRD countries)SudanSurinameSwazilandSwedenSwitzerlandSyrian Arab RepublicTanzaniaThailandTimor-LesteTogoTongaTrinidad and TobagoTunisiaTurkeyUgandaUnited Arab EmiratesUpper middle incomeUruguayVanuatuVenezuela, RBVietnamYemen, Rep.ZambiaZimbabwe línea de tiempo (timeline):
En esta escala de tiempo se presenta un gráfico de 1971 y 2012 de Paraguay. Los datos de 1970 están ausentes. El número de observaciones reales por fecha: 37.
Fuente (nombre):
Indicadores del desarrollo mundial
Fuente (organización):
United Nations Educational, Scientific, and Cultural Organization (UNESCO) Institute for Statistics.
Categorías:
Education, Gender
Se ha actualizado:
23 abr 2017 año
Los indicadores de los cambios de valor en los últimos años
Mínimo:
41.254
1 ene 1971 año
Máximo:
85.837
1 ene 2005 año
A la fecha de observación
Valor
Cambio absoluto
El cambio con respecto al valor anterior
1 ene 1971 año
41.254
+41.254
0.0%
1 ene 1973 año
43.794
+2.539
6.15%
1 ene 1974 año
46.887
+3.094
7.06%
1 ene 1975 año
47.84
+0.953
2.03%
1 ene 1976 año
49.072
+1.232
2.58%
1 ene 1977 año
47.479
-1.592
-3.25%
1 ene 1978 año
48.705
+1.226
2.58%
1 ene 1979 año
50.972
+2.267
4.65%
1 ene 1981 año
51.857
+0.884
1.73%
1 ene 1982 año
54.46
+2.603
5.02%
1 ene 1983 año
54.578
+0.118
0.22%
1 ene 1984 año
57.435
+2.857
5.24%
1 ene 1985 año
58.161
+0.726
1.26%
1 ene 1986 año
56.654
-1.507
-2.59%
1 ene 1987 año
55.687
-0.967
-1.71%
1 ene 1988 año
52.273
-3.414
-6.13%
1 ene 1989 año
52.041
-0.232
-0.44%
1 ene 1990 año
51.945
-0.096
-0.19%
1 ene 1991 año
53.21
+1.265
2.44%
1 ene 1992 año
57.697
+4.487
8.43%
1 ene 1993 año
63.476
+5.779
10.02%
1 ene 1994 año
57.805
-5.671
-8.93%
1 ene 1995 año
58.841
+1.036
1.79%
1 ene 1996 año
63.46
+4.619
7.85%
1 ene 1997 año
65.042
+1.581
2.49%
1 ene 1999 año
79.671
+14.629
22.49%
1 ene 2000 año
76.166
-3.505
-4.4%
1 ene 2003 año
80.055
+3.889
5.11%
1 ene 2004 año
79.361
-0.693
-0.87%
1 ene 2005 año
85.837
+6.475
8.16%
1 ene 2006 año
79.63
-6.207
-7.23%
1 ene 2007 año
82.805
+3.175
3.99%
1 ene 2008 año
82.421
-0.384
-0.46%
1 ene 2009 año
80.844
-1.577
-1.91%
1 ene 2010 año
84.602
+3.758
4.65%
1 ene 2011 año
81.608
-2.994
-3.54%
1 ene 2012 año
85.435
+3.827
4.69%
Ranking de los países por los datos estadísticos actuales


Comentarios: