29
/es/
es
AIzaSyAYiBZKx7MnpbEhh9jyipgxe19OcubqV5w
April 1, 2024
219601
Papua New Guinea
PNG
true
2
1
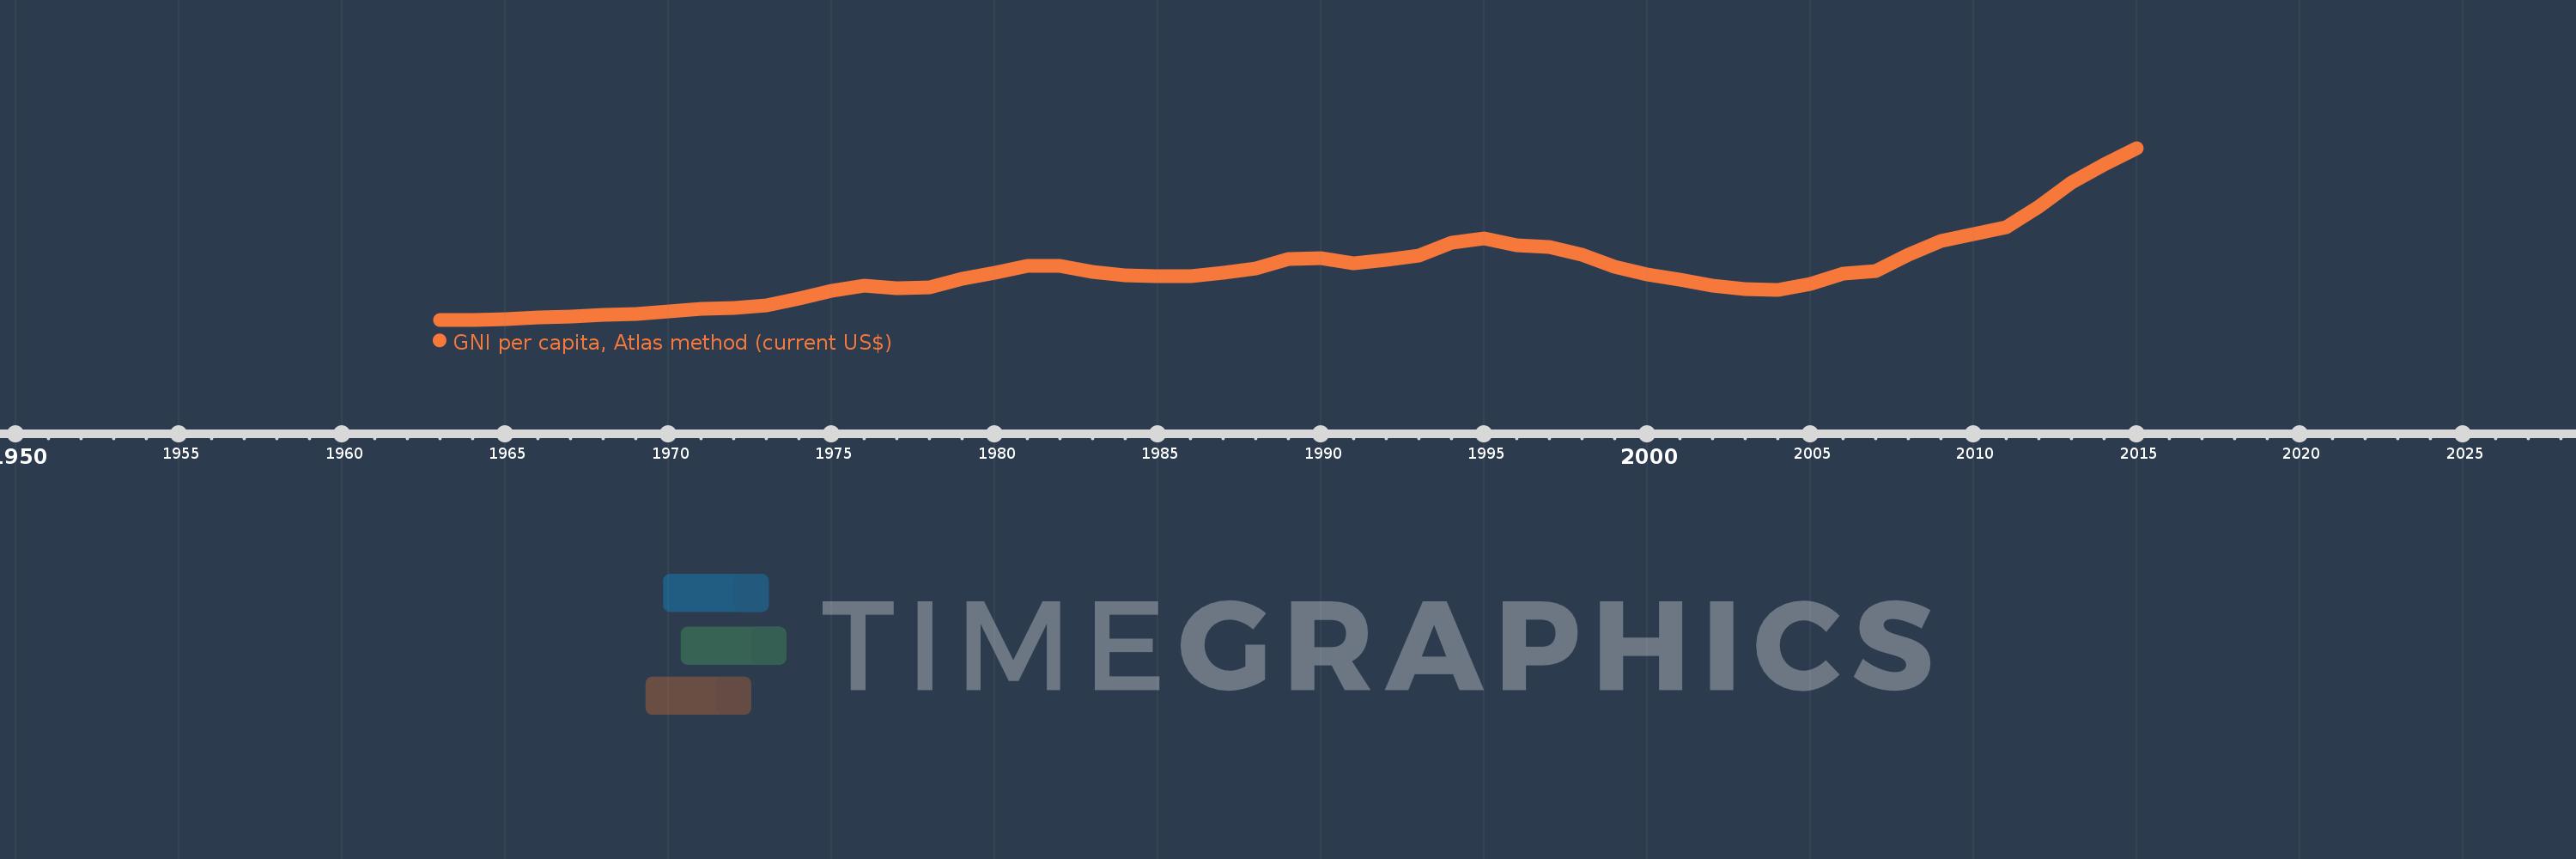
GNI per capita, Atlas method (current US$)
2015,2014,2013,2012,2011,2010,2009,2008,2007,2006,2005,2004,2003,2002,2001,2000,1999,1998,1997,1996,1995,1994,1993,1992,1991,1990,1989,1988,1987,1986,1985,1984,1983,1982,1981,1980,1979,1978,1977,1976,1975,1974,1973,1972,1971,1970,1969,1968,1967,1966,1965,1964,1963
Estas estadísticas en otros países:
AfghanistanAlbaniaAlgeriaAndorraAngolaAntigua and BarbudaArab WorldArgentinaArmeniaAustraliaAustriaAzerbaijanBahamas, TheBahrainBangladeshBarbadosBelarusBelgiumBelizeBeninBermudaBhutanBoliviaBosnia and HerzegovinaBotswanaBrazilBrunei DarussalamBulgariaBurkina FasoBurundiCabo VerdeCambodiaCameroonCanadaCaribbean small statesCentral African RepublicCentral Europe and the BalticsChadChannel IslandsChileChinaColombiaComorosCongo, Dem. Rep.Congo, Rep.Costa RicaCote d'IvoireCroatiaCubaCyprusCzech RepublicDenmarkDjiboutiDominicaDominican RepublicEarly-demographic dividendEast Asia & PacificEast Asia & Pacific (excluding high income)East Asia & Pacific (IDA & IBRD countries)EcuadorEgypt, Arab Rep.El SalvadorEquatorial GuineaEritreaEstoniaEthiopiaEuro areaEurope & Central AsiaEurope & Central Asia (excluding high income)Europe & Central Asia (IDA & IBRD countries)European UnionFijiFinlandFragile and conflict affected situationsFranceFrench PolynesiaGabonGambia, TheGeorgiaGermanyGhanaGreeceGreenlandGrenadaGuatemalaGuineaGuinea-BissauGuyanaHaitiHeavily indebted poor countries (HIPC)High incomeHondurasHong Kong SAR, ChinaHungaryIBRD onlyIcelandIDA & IBRD totalIDA blendIDA onlyIDA totalIndiaIndonesiaIran, Islamic Rep.IraqIrelandIsle of ManIsraelItalyJamaicaJapanJordanKazakhstanKenyaKiribatiKorea, Rep.KosovoKuwaitKyrgyz RepublicLao PDRLate-demographic dividendLatin America & Caribbean Latin America & Caribbean (excluding high income)Latin America & the Caribbean (IDA & IBRD countries)LatviaLeast developed countries: UN classificationLebanonLesothoLiberiaLibyaLiechtensteinLithuaniaLow & middle incomeLow incomeLower middle incomeLuxembourgMacao SAR, ChinaMacedonia, FYRMadagascarMalawiMalaysiaMaldivesMaliMaltaMarshall IslandsMauritaniaMauritiusMexicoMicronesia, Fed. Sts.Middle East & North AfricaMiddle East & North Africa (excluding high income)Middle East & North Africa (IDA & IBRD countries)Middle incomeMoldovaMonacoMongoliaMontenegroMoroccoMozambiqueMyanmarNamibiaNauruNepalNetherlandsNew CaledoniaNew ZealandNicaraguaNigerNigeriaNorth AmericaNorwayOECD membersOmanOther small statesPacific island small statesPakistanPalauPanamaPapua New GuineaParaguayPeruPhilippinesPolandPortugalPost-demographic dividendPre-demographic dividendPuerto RicoQatarRomaniaRussian FederationRwandaSamoaSan MarinoSao Tome and PrincipeSaudi ArabiaSenegalSerbiaSeychellesSierra LeoneSingaporeSlovak RepublicSloveniaSmall statesSolomon IslandsSouth AfricaSouth AsiaSouth Asia (IDA & IBRD)South SudanSpainSri LankaSt. Kitts and NevisSt. LuciaSt. Vincent and the GrenadinesSub-Saharan Africa Sub-Saharan Africa (excluding high income)Sub-Saharan Africa (IDA & IBRD countries)SudanSurinameSwazilandSwedenSwitzerlandSyrian Arab RepublicTajikistanTanzaniaThailandTimor-LesteTogoTongaTrinidad and TobagoTunisiaTurkeyTurkmenistanTuvaluUgandaUkraineUnited Arab EmiratesUnited KingdomUnited StatesUpper middle incomeUruguayUzbekistanVanuatuVenezuela, RBVietnamVirgin Islands (U.S.)West Bank and GazaWorldYemen, Rep.ZambiaZimbabwe línea de tiempo (timeline):
En esta escala de tiempo se presenta un gráfico de 1963 y 2015 de Papua New Guinea. Los datos de 1962 están ausentes. El número de observaciones reales por fecha: 53.
Fuente (nombre):
Indicadores del desarrollo mundial
Fuente (organización):
World Bank national accounts data, and OECD National Accounts data files.
Categorías:
Economy & Growth
Se ha actualizado:
23 abr 2017 año
Los indicadores de los cambios de valor en los últimos años
Mínimo:
130.0
1 ene 1963 año
Máximo:
2.24 mil
1 ene 2015 año
A la fecha de observación
Valor
Cambio absoluto
El cambio con respecto al valor anterior
1 ene 1963 año
130.0
+130.0
0.0%
1 ene 1964 año
130.0
0.0
0.0%
1 ene 1965 año
140.0
+10.0
7.69%
1 ene 1966 año
160.0
+20.0
14.29%
1 ene 1967 año
170.0
+10.0
6.25%
1 ene 1968 año
190.0
+20.0
11.76%
1 ene 1969 año
200.0
+10.0
5.26%
1 ene 1970 año
230.0
+30.0
15.0%
1 ene 1971 año
260.0
+30.0
13.04%
1 ene 1972 año
270.0
+10.0
3.85%
1 ene 1973 año
310.0
+40.0
14.81%
1 ene 1974 año
390.0
+80.0
25.81%
1 ene 1975 año
490.0
+100.0
25.64%
1 ene 1976 año
550.0
+60.0
12.24%
1 ene 1977 año
520.0
-30.0
-5.45%
1 ene 1978 año
530.0
+10.0
1.92%
1 ene 1979 año
630.0
+100.0
18.87%
1 ene 1980 año
710.0
+80.0
12.7%
1 ene 1981 año
790.0
+80.0
11.27%
1 ene 1982 año
790.0
0.0
0.0%
1 ene 1983 año
720.0
-70.0
-8.86%
1 ene 1984 año
680.0
-40.0
-5.56%
1 ene 1985 año
670.0
-10.0
-1.47%
1 ene 1986 año
670.0
0.0
0.0%
1 ene 1987 año
710.0
+40.0
5.97%
1 ene 1988 año
760.0
+50.0
7.04%
1 ene 1989 año
880.0
+120.0
15.79%
1 ene 1990 año
890.0
+10.0
1.14%
1 ene 1991 año
820.0
-70.0
-7.87%
1 ene 1992 año
870.0
+50.0
6.1%
1 ene 1993 año
920.0
+50.0
5.75%
1 ene 1994 año
1.08 mil
+160.0
17.39%
1 ene 1995 año
1.13 mil
+50.0
4.63%
1 ene 1996 año
1.04 mil
-90.0
-7.96%
1 ene 1997 año
1.02 mil
-20.0
-1.92%
1 ene 1998 año
930.0
-90.0
-8.82%
1 ene 1999 año
780.0
-150.0
-16.13%
1 ene 2000 año
690.0
-90.0
-11.54%
1 ene 2001 año
620.0
-70.0
-10.14%
1 ene 2002 año
550.0
-70.0
-11.29%
1 ene 2003 año
510.0
-40.0
-7.27%
1 ene 2004 año
500.0
-10.0
-1.96%
1 ene 2005 año
570.0
+70.0
14.0%
1 ene 2006 año
700.0
+130.0
22.81%
1 ene 2007 año
730.0
+30.0
4.29%
1 ene 2008 año
930.0
+200.0
27.4%
1 ene 2009 año
1.1 mil
+170.0
18.28%
1 ene 2010 año
1.18 mil
+80.0
7.27%
1 ene 2011 año
1.27 mil
+90.0
7.63%
1 ene 2012 año
1.52 mil
+250.0
19.69%
1 ene 2013 año
1.82 mil
+300.0
19.74%
1 ene 2014 año
2.04 mil
+220.0
12.09%
1 ene 2015 año
2.24 mil
+200.0
9.8%
Ranking de los países por los datos estadísticos actuales


Comentarios: