29
/es/
es
AIzaSyAYiBZKx7MnpbEhh9jyipgxe19OcubqV5w
April 1, 2024
214937
Norway
NOR
true
2
1
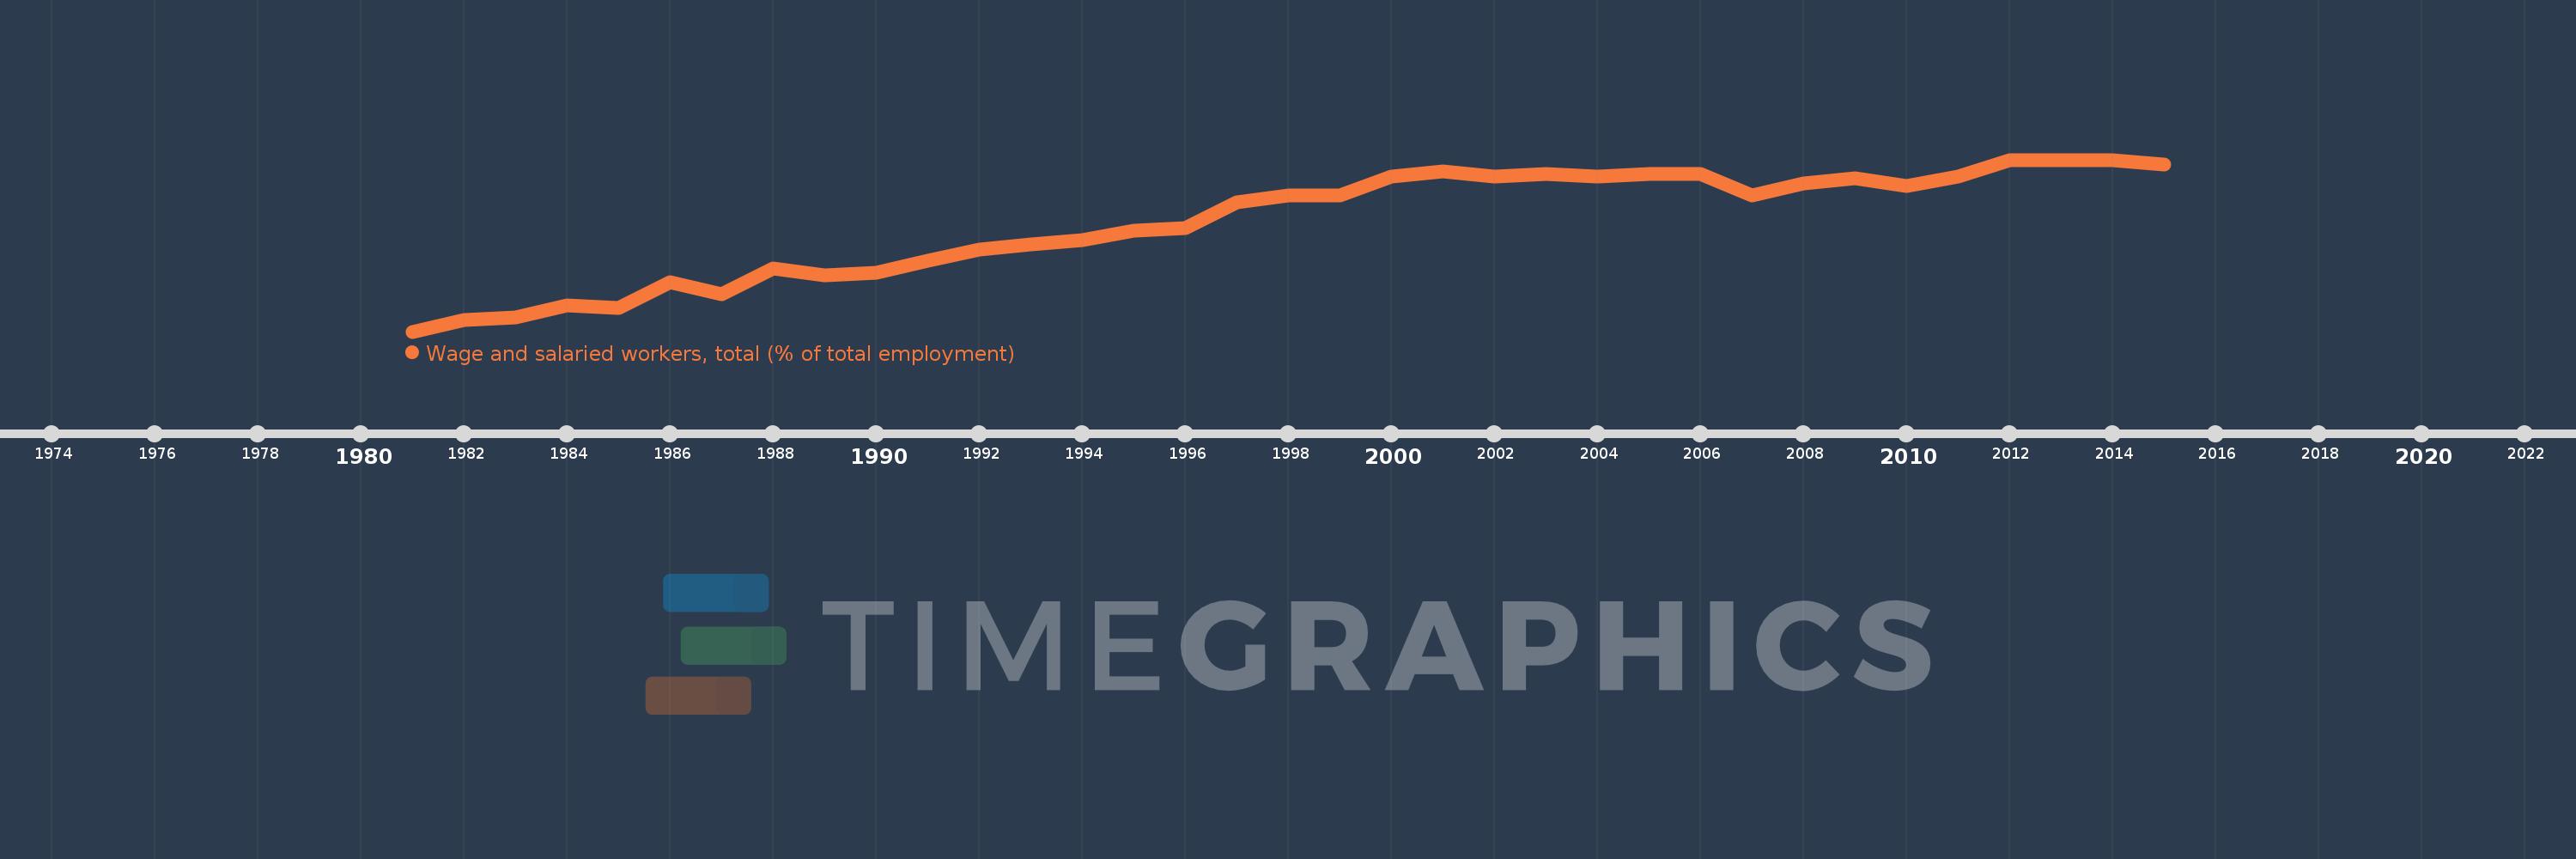
Wage and salaried workers, total (% of total employment)
2015,2014,2013,2012,2011,2010,2009,2008,2007,2006,2005,2004,2003,2002,2001,2000,1999,1998,1997,1996,1995,1994,1993,1992,1991,1990,1989,1988,1987,1986,1985,1984,1983,1982,1981
Estas estadísticas en otros países:
AlbaniaAlgeriaAmerican SamoaAngolaAntigua and BarbudaArgentinaArmeniaArubaAustraliaAustriaAzerbaijanBahamas, TheBahrainBangladeshBarbadosBelarusBelgiumBelizeBeninBermudaBhutanBoliviaBosnia and HerzegovinaBotswanaBrazilBritish Virgin IslandsBrunei DarussalamBulgariaBurkina FasoBurundiCabo VerdeCambodiaCameroonCanadaCaribbean small statesCayman IslandsCentral Europe and the BalticsChadChileChinaColombiaCongo, Rep.Costa RicaCote d'IvoireCroatiaCubaCyprusCzech RepublicDenmarkDjiboutiDominicaDominican RepublicEarly-demographic dividendEast Asia & PacificEast Asia & Pacific (excluding high income)East Asia & Pacific (IDA & IBRD countries)EcuadorEgypt, Arab Rep.El SalvadorEquatorial GuineaEstoniaEthiopiaEuro areaEurope & Central AsiaEurope & Central Asia (excluding high income)Europe & Central Asia (IDA & IBRD countries)European UnionFijiFinlandFranceFrench PolynesiaGabonGambia, TheGeorgiaGermanyGhanaGreeceGrenadaGuamGuatemalaGuineaGuyanaHaitiHigh incomeHondurasHong Kong SAR, ChinaHungaryIBRD onlyIcelandIDA & IBRD totalIndiaIndonesiaIran, Islamic Rep.IrelandIsle of ManIsraelItalyJamaicaJapanJordanKazakhstanKenyaKiribatiKorea, Rep.KosovoKuwaitKyrgyz RepublicLao PDRLate-demographic dividendLatin America & Caribbean Latin America & Caribbean (excluding high income)Latin America & the Caribbean (IDA & IBRD countries)LatviaLebanonLesothoLiberiaLithuaniaLow & middle incomeLower middle incomeLuxembourgMacao SAR, ChinaMacedonia, FYRMadagascarMalawiMalaysiaMaldivesMaliMaltaMarshall IslandsMauritiusMexicoMiddle East & North AfricaMiddle East & North Africa (excluding high income)Middle East & North Africa (IDA & IBRD countries)Middle incomeMoldovaMongoliaMontenegroMoroccoMozambiqueNamibiaNepalNetherlandsNew CaledoniaNew ZealandNicaraguaNigerNorth AmericaNorwayOECD membersOmanPakistanPanamaParaguayPeruPhilippinesPolandPortugalPost-demographic dividendPuerto RicoQatarRomaniaRussian FederationRwandaSamoaSan MarinoSao Tome and PrincipeSaudi ArabiaSenegalSerbiaSeychellesSierra LeoneSingaporeSlovak RepublicSloveniaSouth AfricaSouth AsiaSouth Asia (IDA & IBRD)SpainSri LankaSt. Kitts and NevisSt. LuciaSt. Vincent and the GrenadinesSurinameSwazilandSwedenSwitzerlandSyrian Arab RepublicTajikistanTanzaniaThailandTimor-LesteTogoTongaTrinidad and TobagoTunisiaTurkeyTurks and Caicos IslandsTuvaluUgandaUkraineUnited Arab EmiratesUnited KingdomUnited StatesUpper middle incomeUruguayVanuatuVenezuela, RBVietnamWest Bank and GazaWorldYemen, Rep.ZambiaZimbabwe línea de tiempo (timeline):
En esta escala de tiempo se presenta un gráfico de 1981 y 2015 de Norway. Los datos de 1980 están ausentes. El número de observaciones reales por fecha: 35.
Fuente (nombre):
Indicadores del desarrollo mundial
Fuente (organización):
International Labour Organization, Key Indicators of the Labour Market database.
Categorías:
Social Protection & Labor
Se ha actualizado:
23 abr 2017 año
Los indicadores de los cambios de valor en los últimos años
Mínimo:
85.7
1 ene 1981 año
Máximo:
93.0
1 ene 2012 año
A la fecha de observación
Valor
Cambio absoluto
El cambio con respecto al valor anterior
1 ene 1981 año
85.7
+85.7
0.0%
1 ene 1982 año
86.2
+0.5
0.58%
1 ene 1983 año
86.3
+0.1
0.12%
1 ene 1984 año
86.8
+0.5
0.58%
1 ene 1985 año
86.7
-0.1
-0.12%
1 ene 1986 año
87.8
+1.1
1.27%
1 ene 1987 año
87.3
-0.5
-0.57%
1 ene 1988 año
88.4
+1.1
1.26%
1 ene 1989 año
88.1
-0.3
-0.34%
1 ene 1990 año
88.2
+0.1
0.11%
1 ene 1991 año
88.7
+0.5
0.57%
1 ene 1992 año
89.2
+0.5
0.56%
1 ene 1993 año
89.4
+0.2
0.22%
1 ene 1994 año
89.6
+0.2
0.22%
1 ene 1995 año
90.0
+0.4
0.45%
1 ene 1996 año
90.1
+0.1
0.11%
1 ene 1997 año
91.2
+1.1
1.22%
1 ene 1998 año
91.5
+0.3
0.33%
1 ene 1999 año
91.5
0.0
0.0%
1 ene 2000 año
92.3
+0.8
0.87%
1 ene 2001 año
92.5
+0.2
0.22%
1 ene 2002 año
92.3
-0.2
-0.22%
1 ene 2003 año
92.4
+0.1
0.11%
1 ene 2004 año
92.3
-0.1
-0.11%
1 ene 2005 año
92.4
+0.1
0.11%
1 ene 2006 año
92.4
0.0
0.0%
1 ene 2007 año
91.5
-0.9
-0.97%
1 ene 2008 año
92.0
+0.5
0.55%
1 ene 2009 año
92.2
+0.2
0.22%
1 ene 2010 año
91.9
-0.3
-0.33%
1 ene 2011 año
92.3
+0.4
0.44%
1 ene 2012 año
93.0
+0.7
0.76%
1 ene 2013 año
93.0
0.0
0.0%
1 ene 2014 año
93.0
0.0
0.0%
1 ene 2015 año
92.8
-0.2
-0.22%
Ranking de los países por los datos estadísticos actuales


Comentarios: