29
/es/
es
AIzaSyAYiBZKx7MnpbEhh9jyipgxe19OcubqV5w
April 1, 2024
214791
Norway
NOR
true
2
1
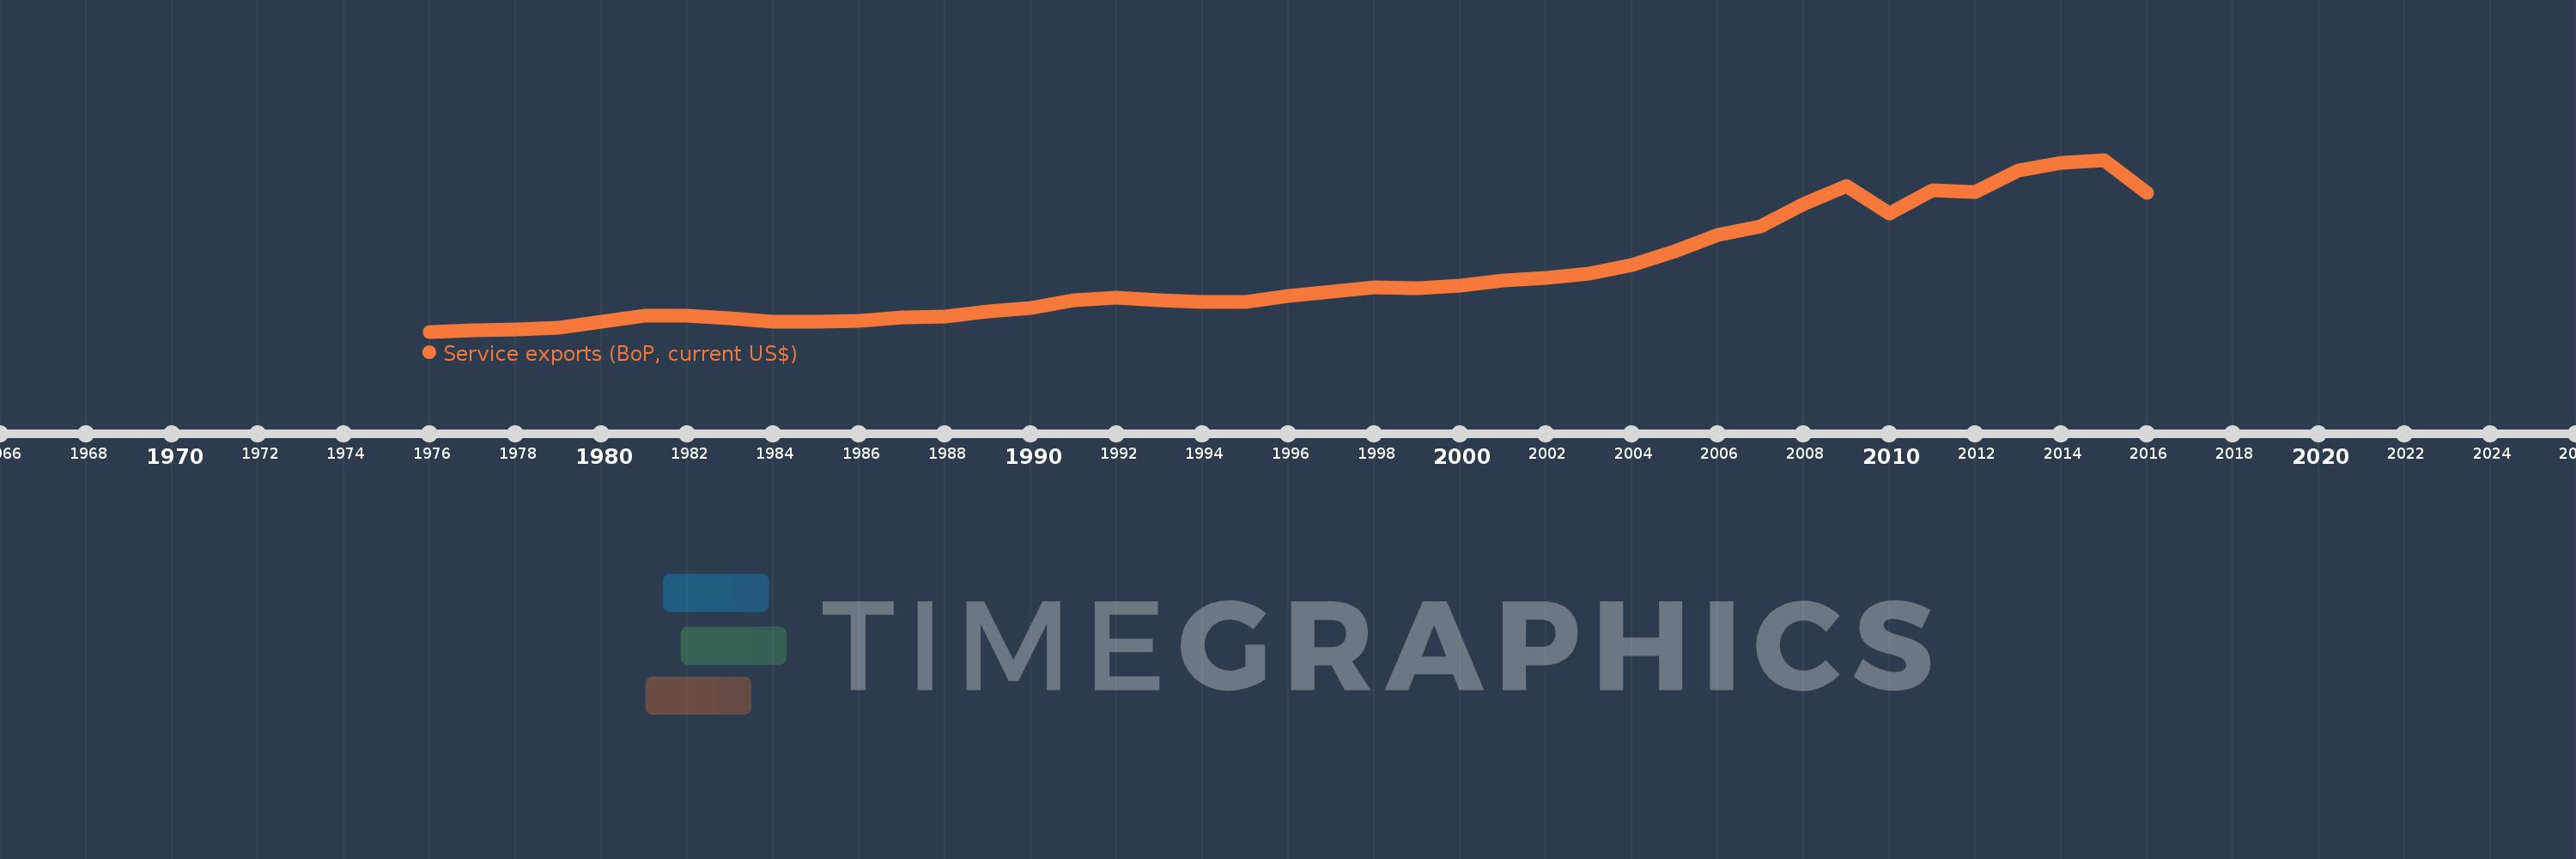
Service exports (BoP, current US$)
2016,2015,2014,2013,2012,2011,2010,2009,2008,2007,2006,2005,2004,2003,2002,2001,2000,1999,1998,1997,1996,1995,1994,1993,1992,1991,1990,1989,1988,1987,1986,1985,1984,1983,1982,1981,1980,1979,1978,1977,1976
Estas estadísticas en otros países:
AfghanistanAlbaniaAlgeriaAngolaAntigua and BarbudaArab WorldArgentinaArmeniaArubaAustraliaAustriaAzerbaijanBahamas, TheBahrainBangladeshBarbadosBelarusBelgiumBelizeBeninBermudaBhutanBoliviaBosnia and HerzegovinaBotswanaBrazilBrunei DarussalamBulgariaBurkina FasoBurundiCabo VerdeCambodiaCameroonCanadaCaribbean small statesCentral African RepublicCentral Europe and the BalticsChadChileChinaColombiaComorosCongo, Dem. Rep.Congo, Rep.Costa RicaCote d'IvoireCroatiaCuracaoCyprusCzech RepublicDenmarkDjiboutiDominicaDominican RepublicEarly-demographic dividendEast Asia & PacificEast Asia & Pacific (excluding high income)East Asia & Pacific (IDA & IBRD countries)EcuadorEgypt, Arab Rep.El SalvadorEquatorial GuineaEritreaEstoniaEthiopiaEuro areaEurope & Central AsiaEurope & Central Asia (excluding high income)Europe & Central Asia (IDA & IBRD countries)European UnionFaroe IslandsFijiFinlandFragile and conflict affected situationsFranceFrench PolynesiaGabonGambia, TheGeorgiaGermanyGhanaGreeceGrenadaGuatemalaGuineaGuinea-BissauGuyanaHaitiHeavily indebted poor countries (HIPC)High incomeHondurasHong Kong SAR, ChinaHungaryIBRD onlyIcelandIDA & IBRD totalIDA blendIDA onlyIDA totalIndiaIndonesiaIran, Islamic Rep.IraqIrelandIsraelItalyJamaicaJapanJordanKazakhstanKenyaKiribatiKorea, Rep.KosovoKuwaitKyrgyz RepublicLao PDRLate-demographic dividendLatin America & Caribbean Latin America & Caribbean (excluding high income)Latin America & the Caribbean (IDA & IBRD countries)LatviaLeast developed countries: UN classificationLebanonLesothoLiberiaLibyaLithuaniaLow & middle incomeLow incomeLower middle incomeLuxembourgMacao SAR, ChinaMacedonia, FYRMadagascarMalawiMalaysiaMaldivesMaliMaltaMarshall IslandsMauritaniaMauritiusMexicoMicronesia, Fed. Sts.Middle East & North Africa (excluding high income)Middle East & North Africa (IDA & IBRD countries)Middle incomeMoldovaMongoliaMontenegroMoroccoMozambiqueMyanmarNamibiaNepalNetherlandsNew CaledoniaNew ZealandNicaraguaNigerNigeriaNorth AmericaNorwayOECD membersOmanPacific island small statesPakistanPalauPanamaPapua New GuineaParaguayPeruPhilippinesPolandPortugalPost-demographic dividendPre-demographic dividendQatarRomaniaRussian FederationRwandaSamoaSao Tome and PrincipeSaudi ArabiaSenegalSerbiaSeychellesSierra LeoneSingaporeSint Maarten (Dutch part)Slovak RepublicSloveniaSolomon IslandsSouth AfricaSouth AsiaSouth Asia (IDA & IBRD)South SudanSpainSri LankaSt. Kitts and NevisSt. LuciaSt. Vincent and the GrenadinesSub-Saharan Africa Sub-Saharan Africa (excluding high income)Sub-Saharan Africa (IDA & IBRD countries)SudanSurinameSwazilandSwedenSwitzerlandSyrian Arab RepublicTajikistanTanzaniaThailandTimor-LesteTogoTongaTrinidad and TobagoTunisiaTurkeyTuvaluUgandaUkraineUnited KingdomUnited StatesUpper middle incomeUruguayVanuatuVenezuela, RBVietnamWest Bank and GazaWorldYemen, Rep.ZambiaZimbabwe línea de tiempo (timeline):
En esta escala de tiempo se presenta un gráfico de 1976 y 2016 de Norway. Los datos de 1975 están ausentes. El número de observaciones reales por fecha: 41.
Fuente (nombre):
Indicadores del desarrollo mundial
Fuente (organización):
International Monetary Fund, Balance of Payments Statistics Yearbook and data files.
Categorías:
Economy & Growth, Trade
Se ha actualizado:
23 abr 2017 año
Los indicadores de los cambios de valor en los últimos años
Mínimo:
4.542 bn
1 ene 1976 año
Máximo:
49.37 bn
1 ene 2015 año
A la fecha de observación
Valor
Cambio absoluto
El cambio con respecto al valor anterior
1 ene 1976 año
4.542 bn
+4.542 bn
0.0%
1 ene 1977 año
4.779 bn
+236.924 millones
5.22%
1 ene 1978 año
5.109 bn
+329.53 millones
6.9%
1 ene 1979 año
5.582 bn
+473.88 millones
9.28%
1 ene 1980 año
7.054 bn
+1.471 bn
26.35%
1 ene 1981 año
8.615 bn
+1.562 bn
22.14%
1 ene 1982 año
8.751 bn
+136.04 millones
1.58%
1 ene 1983 año
7.923 bn
-827.903 millones
-9.46%
1 ene 1984 año
7.11 bn
-812.819 millones
-10.26%
1 ene 1985 año
7.094 bn
-16.613 millones
-0.23%
1 ene 1986 año
7.456 bn
+361.837 millones
5.1%
1 ene 1987 año
8.145 bn
+689.346 millones
9.25%
1 ene 1988 año
8.545 bn
+400.035 millones
4.91%
1 ene 1989 año
9.73 bn
+1.185 bn
13.87%
1 ene 1990 año
10.77 bn
+1.04 bn
10.69%
1 ene 1991 año
12.767 bn
+1.997 bn
18.54%
1 ene 1992 año
13.33 bn
+563.472 millones
4.41%
1 ene 1993 año
12.753 bn
-576.945 millones
-4.33%
1 ene 1994 año
12.25 bn
-502.966 millones
-3.94%
1 ene 1995 año
12.337 bn
+86.893 millones
0.71%
1 ene 1996 año
13.859 bn
+1.522 bn
12.33%
1 ene 1997 año
14.984 bn
+1.125 bn
8.12%
1 ene 1998 año
16.011 bn
+1.027 bn
6.85%
1 ene 1999 año
15.78 bn
-231.338 millones
-1.44%
1 ene 2000 año
16.468 bn
+687.931 millones
4.36%
1 ene 2001 año
17.861 bn
+1.393 bn
8.46%
1 ene 2002 año
18.581 bn
+720.117 millones
4.03%
1 ene 2003 año
19.739 bn
+1.158 bn
6.23%
1 ene 2004 año
21.961 bn
+2.222 bn
11.26%
1 ene 2005 año
25.596 bn
+3.635 bn
16.55%
1 ene 2006 año
29.834 bn
+4.238 bn
16.56%
1 ene 2007 año
32.01 bn
+2.176 bn
7.29%
1 ene 2008 año
37.824 bn
+5.814 bn
18.16%
1 ene 2009 año
42.628 bn
+4.804 bn
12.7%
1 ene 2010 año
35.397 bn
-7.231 bn
-16.96%
1 ene 2011 año
41.453 bn
+6.056 bn
17.11%
1 ene 2012 año
40.942 bn
-510.698 millones
-1.23%
1 ene 2013 año
46.524 bn
+5.582 bn
13.63%
1 ene 2014 año
48.632 bn
+2.108 bn
4.53%
1 ene 2015 año
49.37 bn
+737.837 millones
1.52%
1 ene 2016 año
40.786 bn
-8.583 bn
-17.39%
Ranking de los países por los datos estadísticos actuales


Comentarios: