29
/es/
es
AIzaSyAYiBZKx7MnpbEhh9jyipgxe19OcubqV5w
April 1, 2024
210562
Nicaragua
NIC
true
2
1
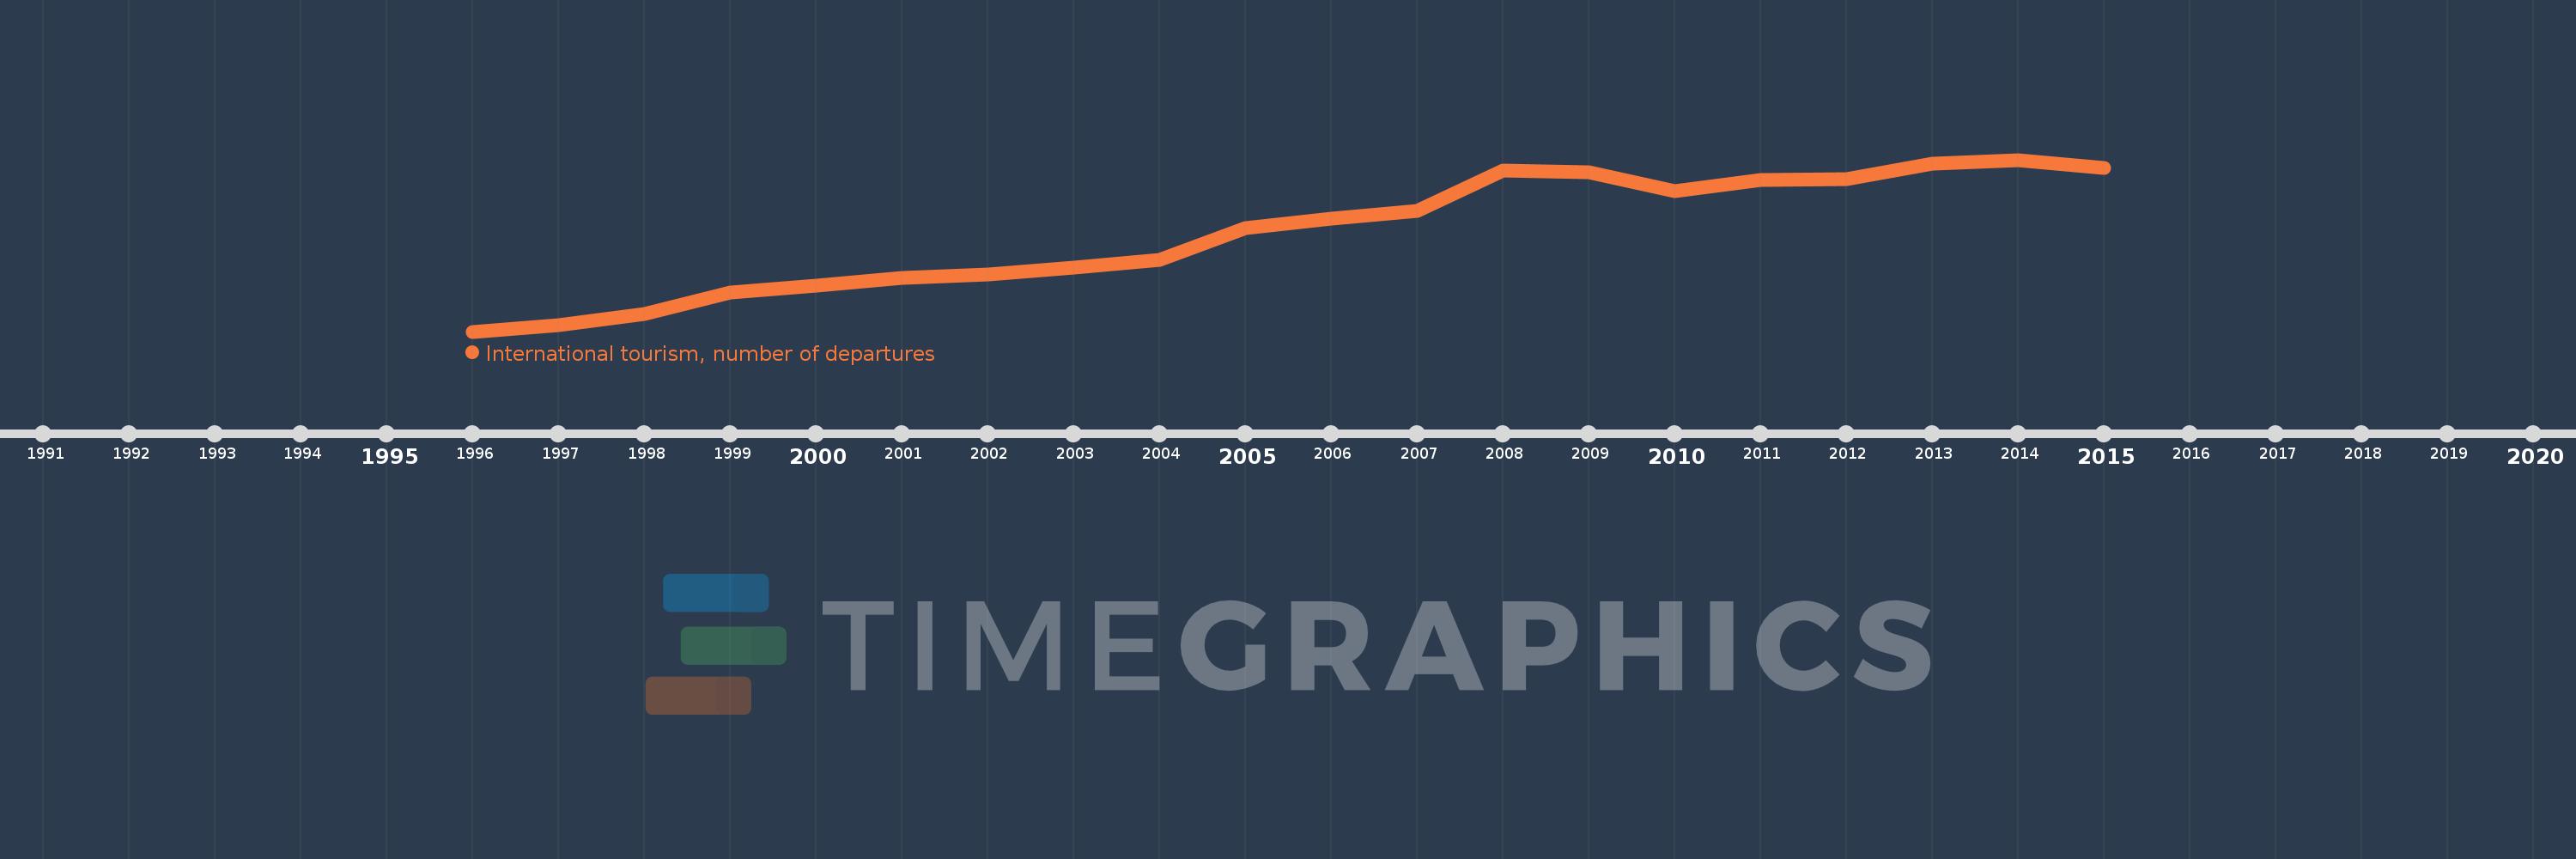
International tourism, number of departures
2015,2014,2013,2012,2011,2010,2009,2008,2007,2006,2005,2004,2003,2002,2001,2000,1999,1998,1997,1996
Estas estadísticas en otros países:
línea de tiempo (timeline):
En esta escala de tiempo se presenta un gráfico de 1996 y 2015 de Nicaragua. Los datos de 1995 están ausentes. El número de observaciones reales por fecha: 20.
Fuente (nombre):
Indicadores del desarrollo mundial
Fuente (organización):
World Tourism Organization, Yearbook of Tourism Statistics, Compendium of Tourism Statistics and data files.
Categorías:
Private Sector, Trade
Se ha actualizado:
23 abr 2017 año
Los indicadores de los cambios de valor en los últimos años
Mínimo:
255.0 mil
1 ene 1996 año
Máximo:
994.0 mil
1 ene 2014 año
A la fecha de observación
Valor
Cambio absoluto
El cambio con respecto al valor anterior
1 ene 1996 año
255.0 mil
+255.0 mil
0.0%
1 ene 1997 año
282.0 mil
+27.0 mil
10.59%
1 ene 1998 año
330.0 mil
+48.0 mil
17.02%
1 ene 1999 año
422.0 mil
+92.0 mil
27.88%
1 ene 2000 año
452.0 mil
+30.0 mil
7.11%
1 ene 2001 año
486.0 mil
+34.0 mil
7.52%
1 ene 2002 año
499.0 mil
+13.0 mil
2.67%
1 ene 2003 año
532.0 mil
+33.0 mil
6.61%
1 ene 2004 año
562.0 mil
+30.0 mil
5.64%
1 ene 2005 año
701.0 mil
+139.0 mil
24.73%
1 ene 2006 año
740.0 mil
+39.0 mil
5.56%
1 ene 2007 año
773.0 mil
+33.0 mil
4.46%
1 ene 2008 año
949.0 mil
+176.0 mil
22.77%
1 ene 2009 año
942.0 mil
-7.0 mil
-0.74%
1 ene 2010 año
858.0 mil
-84.0 mil
-8.92%
1 ene 2011 año
908.0 mil
+50.0 mil
5.83%
1 ene 2012 año
912.0 mil
+4.0 mil
0.44%
1 ene 2013 año
979.0 mil
+67.0 mil
7.35%
1 ene 2014 año
994.0 mil
+15.0 mil
1.53%
1 ene 2015 año
959.0 mil
-35.0 mil
-3.52%
Ranking de los países por los datos estadísticos actuales


Comentarios: