29
/es/
es
AIzaSyAYiBZKx7MnpbEhh9jyipgxe19OcubqV5w
April 1, 2024
208252
Netherlands
NLD
true
2
1
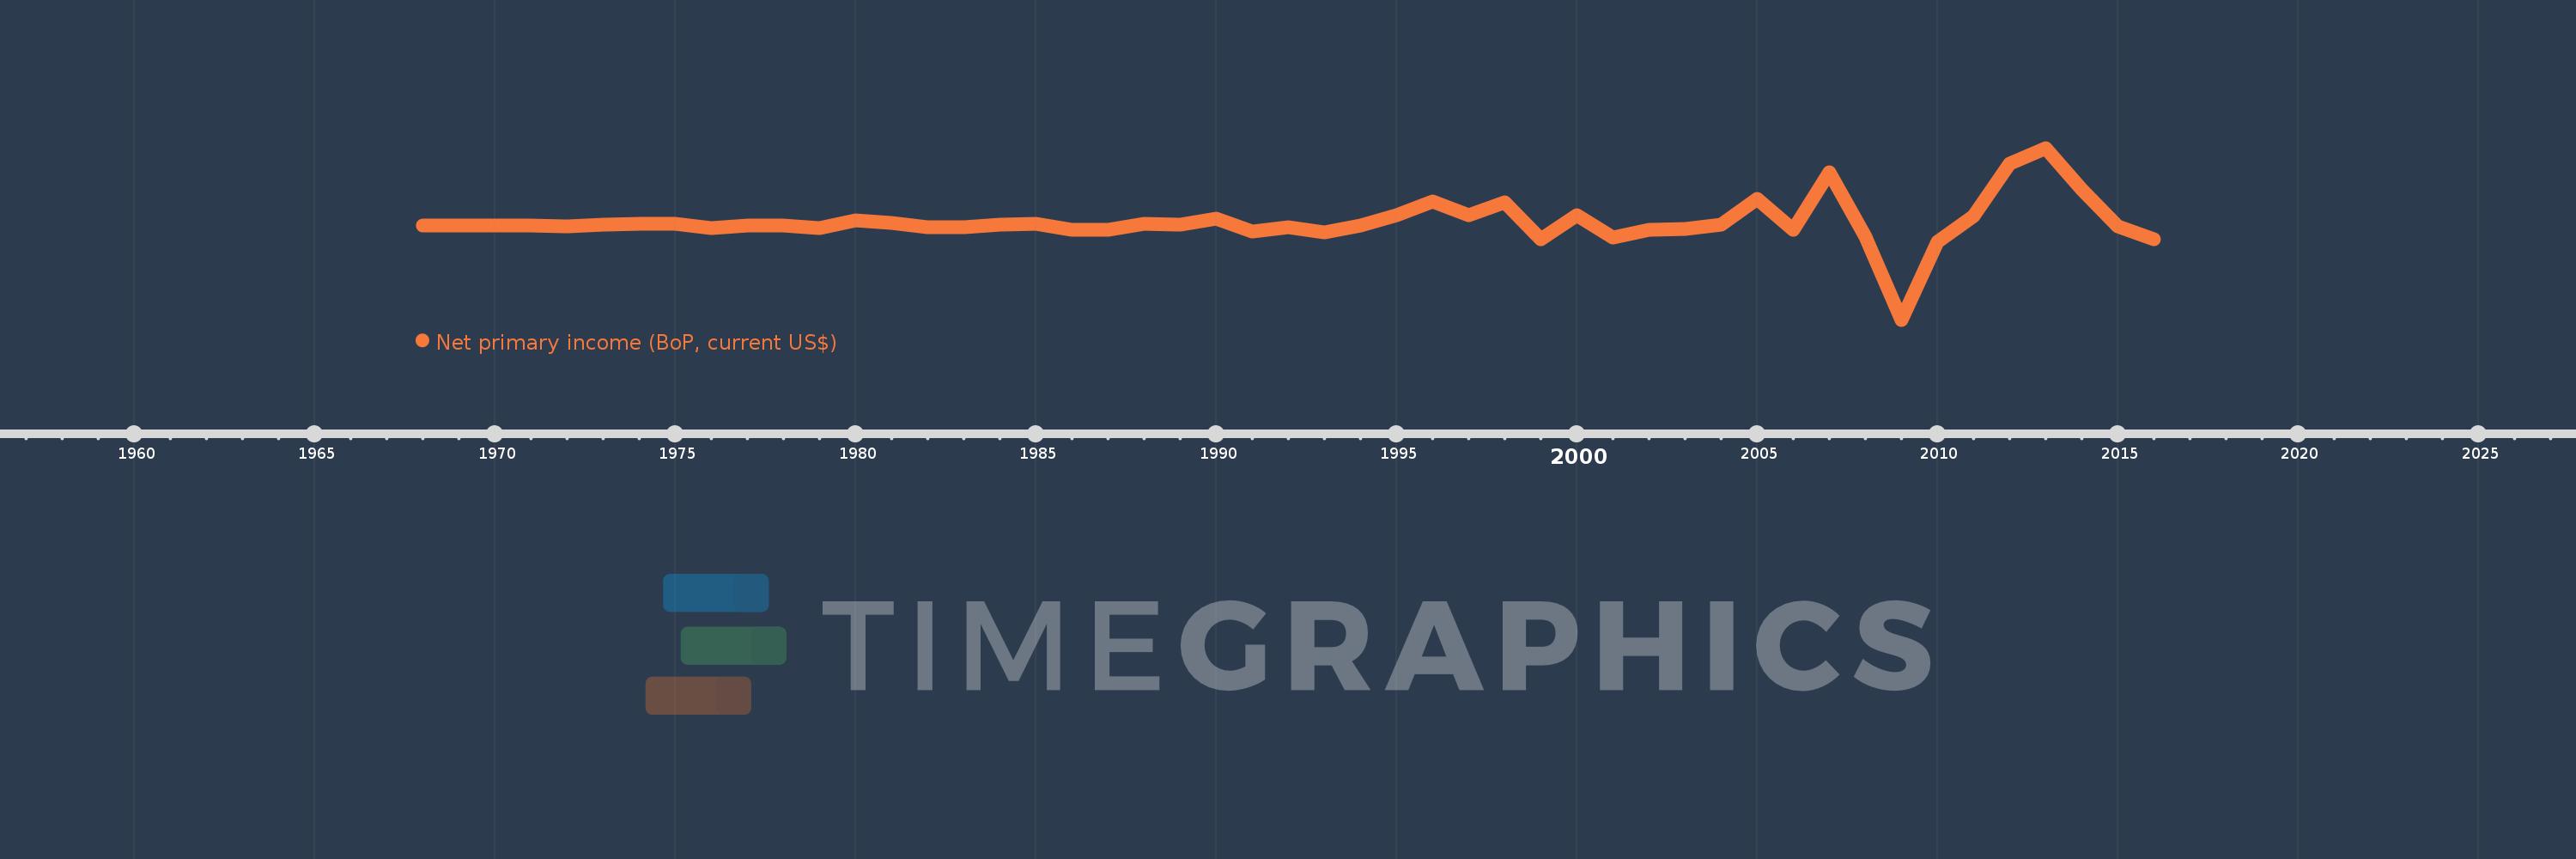
Net primary income (BoP, current US$)
2016,2015,2014,2013,2012,2011,2010,2009,2008,2007,2006,2005,2004,2003,2002,2001,2000,1999,1998,1997,1996,1995,1994,1993,1992,1991,1990,1989,1988,1987,1986,1985,1984,1983,1982,1981,1980,1979,1978,1977,1976,1975,1974,1973,1972,1971,1970,1969,1968
Estas estadísticas en otros países:
AfghanistanAlbaniaAlgeriaAngolaAntigua and BarbudaArgentinaArmeniaArubaAustraliaAustriaAzerbaijanBahamas, TheBahrainBangladeshBarbadosBelarusBelgiumBelizeBeninBermudaBhutanBoliviaBosnia and HerzegovinaBotswanaBrazilBrunei DarussalamBulgariaBurkina FasoBurundiCabo VerdeCambodiaCameroonCanadaCentral African RepublicChadChileChinaColombiaComorosCongo, Dem. Rep.Congo, Rep.Costa RicaCote d'IvoireCroatiaCuracaoCyprusCzech RepublicDenmarkDjiboutiDominicaDominican RepublicEcuadorEgypt, Arab Rep.El SalvadorEquatorial GuineaEritreaEstoniaEthiopiaEuro areaFaroe IslandsFijiFinlandFranceFrench PolynesiaGabonGambia, TheGeorgiaGermanyGhanaGreeceGrenadaGuatemalaGuineaGuinea-BissauGuyanaHaitiHondurasHong Kong SAR, ChinaHungaryIcelandIndiaIndonesiaIran, Islamic Rep.IraqIrelandIsraelItalyJamaicaJapanJordanKazakhstanKenyaKiribatiKorea, Rep.KosovoKuwaitKyrgyz RepublicLao PDRLatviaLebanonLesothoLiberiaLibyaLithuaniaLuxembourgMacao SAR, ChinaMacedonia, FYRMadagascarMalawiMalaysiaMaldivesMaliMaltaMarshall IslandsMauritaniaMauritiusMexicoMicronesia, Fed. Sts.MoldovaMongoliaMontenegroMoroccoMozambiqueMyanmarNamibiaNepalNetherlandsNew CaledoniaNew ZealandNicaraguaNigerNigeriaNorwayOmanPakistanPalauPanamaPapua New GuineaParaguayPeruPhilippinesPolandPortugalQatarRomaniaRussian FederationRwandaSamoaSao Tome and PrincipeSaudi ArabiaSenegalSerbiaSeychellesSierra LeoneSingaporeSint Maarten (Dutch part)Slovak RepublicSloveniaSolomon IslandsSouth AfricaSouth SudanSpainSri LankaSt. Kitts and NevisSt. LuciaSt. Vincent and the GrenadinesSudanSurinameSwazilandSwedenSwitzerlandSyrian Arab RepublicTajikistanTanzaniaThailandTimor-LesteTogoTongaTrinidad and TobagoTunisiaTurkeyTuvaluUgandaUkraineUnited KingdomUnited StatesUruguayVanuatuVenezuela, RBVietnamWest Bank and GazaYemen, Rep.ZambiaZimbabwe línea de tiempo (timeline):
En esta escala de tiempo se presenta un gráfico de 1968 y 2016 de Netherlands. Los datos de 1967 están ausentes. El número de observaciones reales por fecha: 49.
Fuente (nombre):
Indicadores del desarrollo mundial
Fuente (organización):
International Monetary Fund, Balance of Payments Statistics Yearbook and data files.
Categorías:
Economy & Growth
Se ha actualizado:
23 abr 2017 año
Los indicadores de los cambios de valor en los últimos años
Mínimo:
-23.699 bn
1 ene 2009 año
Máximo:
21.176 bn
1 ene 2013 año
A la fecha de observación
Valor
Cambio absoluto
El cambio con respecto al valor anterior
1 ene 1968 año
924.862 millones
+924.862 millones
0.0%
1 ene 1969 año
870.718 millones
-54.144 millones
-5.85%
1 ene 1970 año
933.702 millones
+62.983 millones
7.23%
1 ene 1971 año
836.74 millones
-96.961 millones
-10.38%
1 ene 1972 año
782.301 millones
-54.439 millones
-6.51%
1 ene 1973 año
1.033 bn
+251.039 millones
32.09%
1 ene 1974 año
1.396 bn
+362.973 millones
35.13%
1 ene 1975 año
1.445 bn
+48.687 millones
3.49%
1 ene 1976 año
336.983 millones
-1.108 bn
-76.68%
1 ene 1977 año
988.928 millones
+651.946 millones
193.47%
1 ene 1978 año
908.86 millones
-80.068 millones
-8.1%
1 ene 1979 año
237.172 millones
-671.688 millones
-73.9%
1 ene 1980 año
2.282 bn
+2.045 bn
862.12%
1 ene 1981 año
1.535 bn
-746.422 millones
-32.71%
1 ene 1982 año
368.532 millones
-1.167 bn
-76.0%
1 ene 1983 año
379.862 millones
+11.33 millones
3.07%
1 ene 1984 año
1.113 bn
+733.189 millones
193.01%
1 ene 1985 año
1.35 bn
+237.056 millones
21.3%
1 ene 1986 año
-235.627 millones
-1.586 bn
-117.45%
1 ene 1987 año
-192.392 millones
+43.235 millones
-18.35%
1 ene 1988 año
1.327 bn
+1.519 bn
-789.62%
1 ene 1989 año
1.119 bn
-208.128 millones
-15.69%
1 ene 1990 año
2.821 bn
+1.703 bn
152.2%
1 ene 1991 año
-620.225 millones
-3.441 bn
-121.98%
1 ene 1992 año
432.062 millones
+1.052 bn
-169.66%
1 ene 1993 año
-929.223 millones
-1.361 bn
-315.07%
1 ene 1994 año
880.925 millones
+1.81 bn
-194.8%
1 ene 1995 año
3.667 bn
+2.786 bn
316.21%
1 ene 1996 año
7.247 bn
+3.581 bn
97.66%
1 ene 1997 año
3.547 bn
-3.7 bn
-51.06%
1 ene 1998 año
6.984 bn
+3.437 bn
96.91%
1 ene 1999 año
-2.693 bn
-9.677 bn
-138.56%
1 ene 2000 año
3.526 bn
+6.219 bn
-230.96%
1 ene 2001 año
-2.297 bn
-5.823 bn
-165.13%
1 ene 2002 año
-172.482 millones
+2.124 bn
-92.49%
1 ene 2003 año
58.583 millones
+231.065 millones
-133.96%
1 ene 2004 año
1.233 bn
+1.174 bn
2.0 mil%
1 ene 2005 año
7.809 bn
+6.576 bn
533.41%
1 ene 2006 año
-300.24 millones
-8.109 bn
-103.84%
1 ene 2007 año
14.734 bn
+15.034 bn
-5.01 mil%
1 ene 2008 año
-2.024 bn
-16.757 bn
-113.73%
1 ene 2009 año
-23.699 bn
-21.676 bn
1.07 mil%
1 ene 2010 año
-3.432 bn
+20.268 bn
-85.52%
1 ene 2011 año
3.395 bn
+6.827 bn
-198.93%
1 ene 2012 año
17.058 bn
+13.662 bn
402.41%
1 ene 2013 año
21.176 bn
+4.119 bn
24.15%
1 ene 2014 año
10.378 bn
-10.798 bn
-50.99%
1 ene 2015 año
677.968 millones
-9.7 bn
-93.47%
1 ene 2016 año
-2.566 bn
-3.244 bn
-478.45%
Ranking de los países por los datos estadísticos actuales


Comentarios: